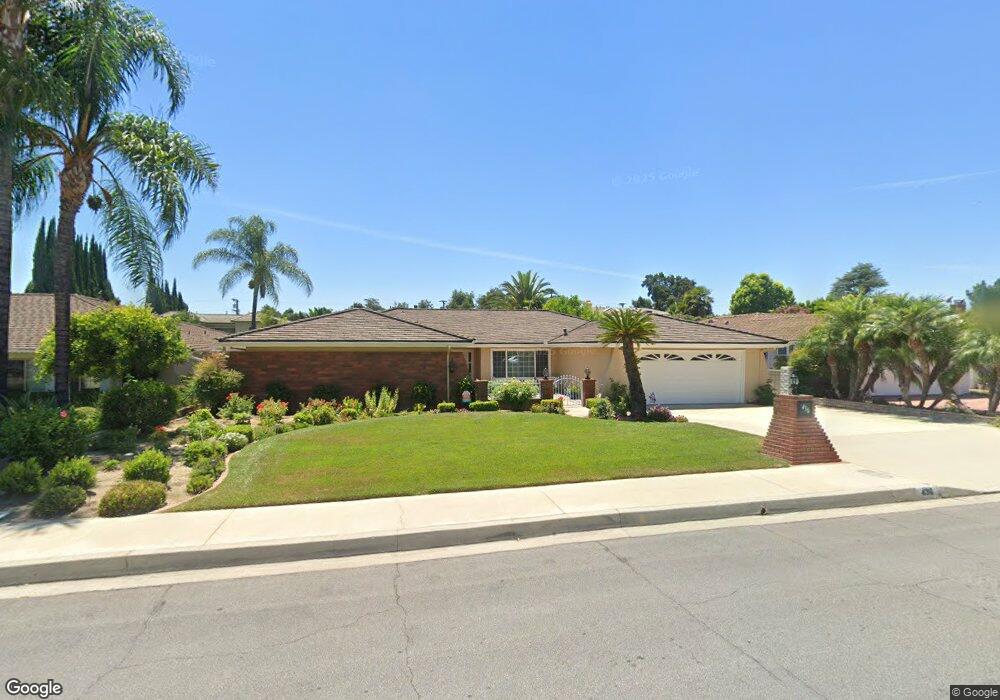
436 W Winnie Way Arcadia, CA 91007
Estimated Value: $1,436,000 - $2,034,000
4
Beds
3
Baths
2,347
Sq Ft
$763/Sq Ft
Est. Value
About This Home
This home is located at 436 W Winnie Way, Arcadia, CA 91007 and is currently estimated at $1,791,087, approximately $763 per square foot. 436 W Winnie Way is a home located in Los Angeles County with nearby schools including Baldwin Stocker Elementary School, First Avenue Middle School, and Arcadia High School.
Ownership History
Date
Name
Owned For
Owner Type
Purchase Details
Closed on
Sep 27, 2018
Sold by
Cirpriani Judie A and The Gilbert F And Lucille F Ho
Bought by
Cirpriani Judie A
Current Estimated Value
Purchase Details
Closed on
May 29, 1998
Sold by
Horstman Lucille E and The Gilbert F & Lucille E Hors
Bought by
Horstman Lucille E and The Gilbert F & Lucille E Horstman Lifet
Purchase Details
Closed on
Dec 20, 1996
Sold by
Horstman Lucille E and Horstman Gilbert F
Bought by
Horstman Lucille E and Gilbert F & Lucille E Horstman Lifetime
Purchase Details
Closed on
Jun 24, 1994
Sold by
Bressan Mario and Bressan Angela
Bought by
Horstman Gilbert F
Home Financials for this Owner
Home Financials are based on the most recent Mortgage that was taken out on this home.
Original Mortgage
$200,000
Interest Rate
4.12%
Create a Home Valuation Report for This Property
The Home Valuation Report is an in-depth analysis detailing your home's value as well as a comparison with similar homes in the area
Home Values in the Area
Average Home Value in this Area
Purchase History
| Date | Buyer | Sale Price | Title Company |
|---|---|---|---|
| Cirpriani Judie A | -- | None Available | |
| Horstman Lucille E | -- | -- | |
| Horstman Lucille E | -- | -- | |
| Horstman Lucille E | -- | -- | |
| Horstman Gilbert F | $500,000 | Investors Title Company |
Source: Public Records
Mortgage History
| Date | Status | Borrower | Loan Amount |
|---|---|---|---|
| Previous Owner | Horstman Gilbert F | $200,000 |
Source: Public Records
Tax History
| Year | Tax Paid | Tax Assessment Tax Assessment Total Assessment is a certain percentage of the fair market value that is determined by local assessors to be the total taxable value of land and additions on the property. | Land | Improvement |
|---|---|---|---|---|
| 2025 | $9,791 | $839,836 | $386,323 | $453,513 |
| 2024 | $9,791 | $823,370 | $378,749 | $444,621 |
| 2023 | $9,592 | $807,226 | $371,323 | $435,903 |
| 2022 | $16,147 | $1,408,577 | $988,107 | $420,470 |
| 2021 | $15,561 | $1,380,959 | $968,733 | $412,226 |
| 2020 | $15,364 | $1,366,800 | $958,800 | $408,000 |
| 2019 | $8,823 | $752,870 | $346,320 | $406,550 |
| 2018 | $8,527 | $738,109 | $339,530 | $398,579 |
| 2016 | $8,300 | $709,449 | $326,347 | $383,102 |
| 2015 | $8,157 | $698,793 | $321,445 | $377,348 |
| 2014 | $8,048 | $685,106 | $315,149 | $369,957 |
Source: Public Records
Map
Nearby Homes
- 515 W Le Roy Ave
- 1522 S Baldwin Ave Unit 15
- 239 W Norman Ave
- 415 W Duarte Rd Unit 6
- 485 W Duarte Rd
- 209 W Camino Real Ave
- 631 W Longden Ave
- 1022 La Cadena Ave Unit A
- 214 W Le Roy Ave
- 540 Fairview Ave Unit 34
- 202 W Lemon Ave
- 466 Walnut Ave
- 618 Fairview Ave Unit 109
- 618 Fairview Ave Unit 107
- 212 W Las Flores Ave
- 541 Rosemarie Dr
- 573 Fairview Ave
- 579 Fairview Ave Unit 14
- 188 W Arthur Ave
- 630 W Huntington Dr Unit 119
- 430 W Winnie Way
- 442 W Winnie Way
- 424 W Winnie Way
- 439 W Norman Ave
- 448 W Winnie Way
- 435 W Norman Ave
- 445 W Norman Ave
- 429 W Norman Ave
- 433 W Winnie Way
- 439 W Winnie Way
- 452 W Winnie Way
- 427 W Winnie Way
- 418 W Winnie Way
- 445 W Winnie Way
- 451 W Norman Ave
- 423 W Norman Ave
- 421 W Winnie Way
- 451 W Winnie Way
- 459 W Norman Ave
- 458 W Winnie Way
Your Personal Tour Guide
Ask me questions while you tour the home.