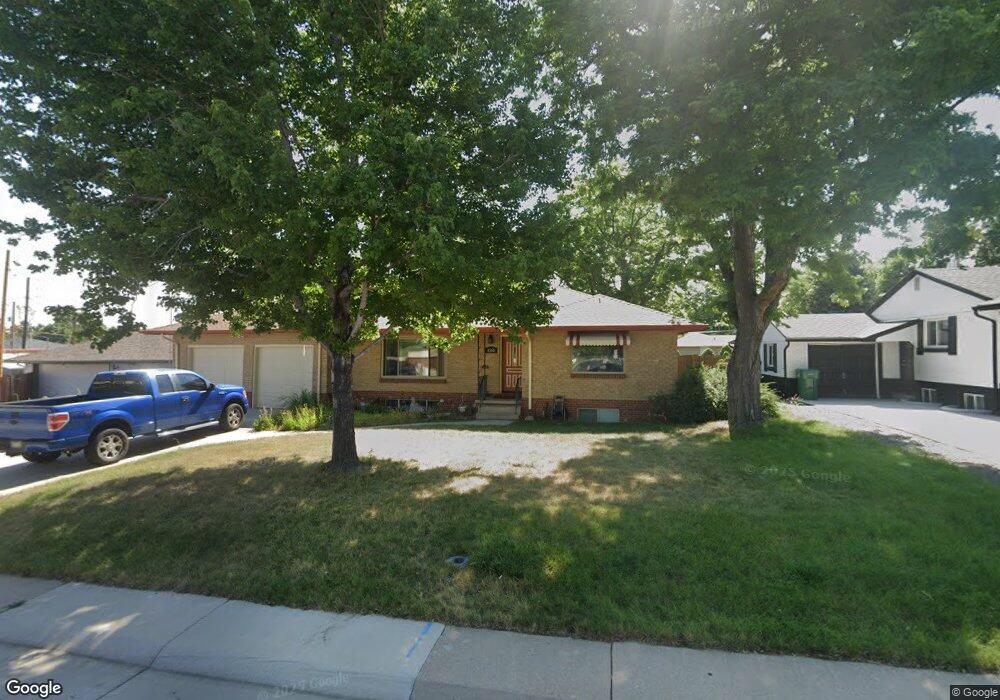
4360 Upham St Wheat Ridge, CO 80033
Barths NeighborhoodEstimated Value: $572,425 - $661,000
3
Beds
3
Baths
1,516
Sq Ft
$410/Sq Ft
Est. Value
About This Home
This home is located at 4360 Upham St, Wheat Ridge, CO 80033 and is currently estimated at $621,606, approximately $410 per square foot. 4360 Upham St is a home located in Jefferson County with nearby schools including Stevens Elementary School, Everitt Middle School, and Wheat Ridge High School.
Ownership History
Date
Name
Owned For
Owner Type
Purchase Details
Closed on
Mar 19, 2024
Sold by
Carver Richard A and Carver Amy Marie
Bought by
Carver Protection Trust and Carver
Current Estimated Value
Purchase Details
Closed on
Dec 25, 2002
Sold by
Reil Amy Marie
Bought by
Carver Richard A and Carver Amy Marie
Home Financials for this Owner
Home Financials are based on the most recent Mortgage that was taken out on this home.
Original Mortgage
$120,750
Interest Rate
5.89%
Purchase Details
Closed on
Jan 24, 1994
Sold by
Reil Amy Marie
Bought by
Carver Richard A and Carver Amy Marie
Home Financials for this Owner
Home Financials are based on the most recent Mortgage that was taken out on this home.
Original Mortgage
$105,550
Interest Rate
7.16%
Mortgage Type
FHA
Purchase Details
Closed on
Oct 17, 1988
Sold by
Reil Richard Guy
Bought by
Reil Amy Marie
Create a Home Valuation Report for This Property
The Home Valuation Report is an in-depth analysis detailing your home's value as well as a comparison with similar homes in the area
Home Values in the Area
Average Home Value in this Area
Purchase History
| Date | Buyer | Sale Price | Title Company |
|---|---|---|---|
| Carver Protection Trust | -- | None Listed On Document | |
| Carver Richard A | -- | -- | |
| Carver Richard A | -- | -- | |
| Reil Amy Marie | -- | -- |
Source: Public Records
Mortgage History
| Date | Status | Borrower | Loan Amount |
|---|---|---|---|
| Previous Owner | Carver Richard A | $120,750 | |
| Previous Owner | Carver Richard A | $105,550 |
Source: Public Records
Tax History
| Year | Tax Paid | Tax Assessment Tax Assessment Total Assessment is a certain percentage of the fair market value that is determined by local assessors to be the total taxable value of land and additions on the property. | Land | Improvement |
|---|---|---|---|---|
| 2025 | $3,011 | $38,312 | $16,589 | $21,723 |
| 2024 | $2,559 | $35,962 | $14,368 | $21,594 |
| 2023 | $2,559 | $35,962 | $14,368 | $21,594 |
| 2022 | $2,045 | $29,915 | $14,399 | $15,516 |
| 2021 | $2,073 | $30,776 | $14,813 | $15,963 |
| 2020 | $1,858 | $28,432 | $13,978 | $14,454 |
| 2019 | $1,833 | $28,432 | $13,978 | $14,454 |
| 2018 | $1,643 | $25,638 | $8,419 | $17,219 |
| 2017 | $1,484 | $25,638 | $8,419 | $17,219 |
| 2016 | $1,304 | $23,129 | $5,967 | $17,162 |
| 2015 | $1,006 | $23,129 | $5,967 | $17,162 |
| 2014 | $1,006 | $18,937 | $5,445 | $13,492 |
Source: Public Records
Map
Nearby Homes
- 4350 Upham St
- 4350 Upham St Unit B
- 4355 Teller St
- 7250 W 44th Ave
- 4345 Teller St
- 4365 Teller St
- 4340 Upham St
- 4335 Teller St
- 4325 Teller St
- 4320 Upham St
- 4350 Teller St
- 4370 Teller St
- 4315 Teller St
- 7301 W 44th Ave
- 7170 W 44th Ave
- 4340 Teller St
- 4310 Upham St
- 4305 Teller St
- 7337 W 44th Ave
- 7065 W 43rd Place
Your Personal Tour Guide
Ask me questions while you tour the home.