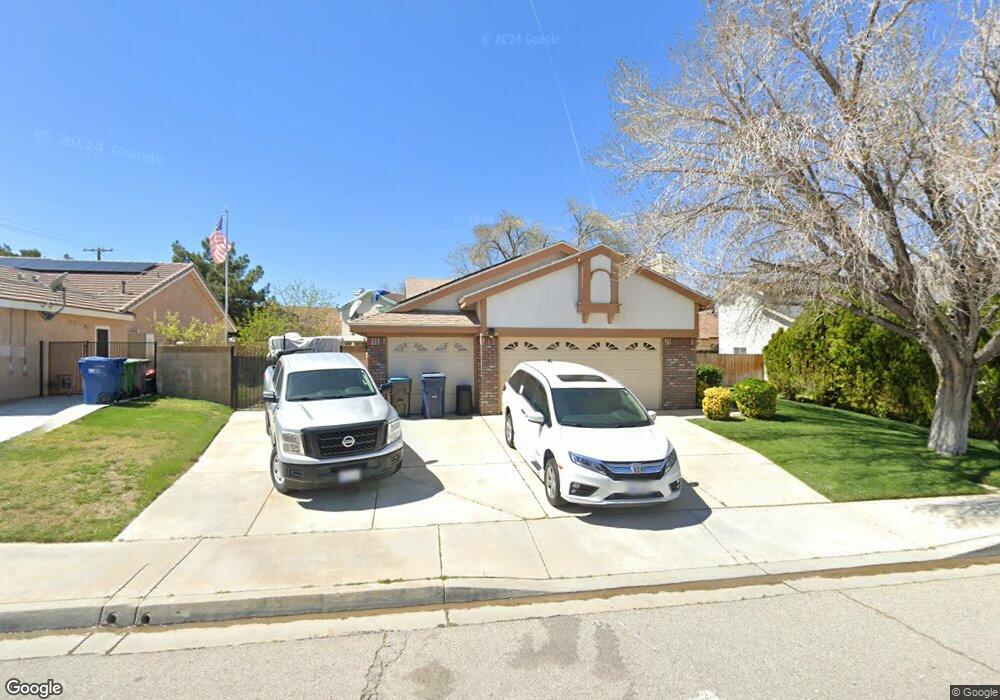
43611 27th St E Lancaster, CA 93535
East Lancaster NeighborhoodEstimated Value: $390,849 - $425,000
3
Beds
2
Baths
1,357
Sq Ft
$303/Sq Ft
Est. Value
About This Home
This home is located at 43611 27th St E, Lancaster, CA 93535 and is currently estimated at $411,712, approximately $303 per square foot. 43611 27th St E is a home located in Los Angeles County with nearby schools including Columbia Elementary School, Gifford C. Cole Middle School, and Eastside High School.
Ownership History
Date
Name
Owned For
Owner Type
Purchase Details
Closed on
Dec 5, 2000
Sold by
Santos Carlos M
Bought by
Kennard John H
Current Estimated Value
Purchase Details
Closed on
Aug 19, 1997
Sold by
Hud
Bought by
Santos Carlos M and Santos Patricia C
Home Financials for this Owner
Home Financials are based on the most recent Mortgage that was taken out on this home.
Original Mortgage
$50,400
Interest Rate
8.37%
Purchase Details
Closed on
Apr 25, 1997
Sold by
Headington Jodine D
Bought by
Homeside Lending Inc and Bancboston Mtg Corp
Purchase Details
Closed on
Mar 27, 1997
Sold by
Homeside Lending Inc
Bought by
Hud
Purchase Details
Closed on
Jul 22, 1996
Sold by
Partners With America Corp
Bought by
Spindel Jodine D
Purchase Details
Closed on
Mar 11, 1995
Sold by
Spindel Jodine D
Bought by
Partners With America and Jodine D & Richard Spindel Trust
Purchase Details
Closed on
Mar 15, 1994
Sold by
Arnsparger Robert A
Bought by
Headington Jodine D
Create a Home Valuation Report for This Property
The Home Valuation Report is an in-depth analysis detailing your home's value as well as a comparison with similar homes in the area
Home Values in the Area
Average Home Value in this Area
Purchase History
| Date | Buyer | Sale Price | Title Company |
|---|---|---|---|
| Kennard John H | $106,000 | Fidelity National Title Co | |
| Santos Carlos M | $63,000 | Stewart Title | |
| Homeside Lending Inc | -- | First Southwestern Title Co | |
| Hud | -- | First Southwestern Title Co | |
| Spindel Jodine D | -- | -- | |
| Partners With America | -- | First American Title Company | |
| Headington Jodine D | -- | Chicago Title Company |
Source: Public Records
Mortgage History
| Date | Status | Borrower | Loan Amount |
|---|---|---|---|
| Previous Owner | Santos Carlos M | $50,400 | |
| Closed | Santos Carlos M | $12,600 |
Source: Public Records
Tax History
| Year | Tax Paid | Tax Assessment Tax Assessment Total Assessment is a certain percentage of the fair market value that is determined by local assessors to be the total taxable value of land and additions on the property. | Land | Improvement |
|---|---|---|---|---|
| 2025 | $3,187 | $159,698 | $24,096 | $135,602 |
| 2024 | $3,187 | $156,568 | $23,624 | $132,944 |
| 2023 | $3,097 | $153,499 | $23,161 | $130,338 |
| 2022 | $3,057 | $150,490 | $22,707 | $127,783 |
| 2021 | $2,695 | $147,540 | $22,262 | $125,278 |
| 2019 | $2,569 | $143,165 | $21,602 | $121,563 |
| 2018 | $2,527 | $140,359 | $21,179 | $119,180 |
| 2016 | $2,409 | $134,910 | $20,357 | $114,553 |
| 2015 | $2,378 | $132,885 | $20,052 | $112,833 |
| 2014 | $2,389 | $130,283 | $19,660 | $110,623 |
Source: Public Records
Map
Nearby Homes
- 43716 La Paz Ln
- 43752 Tranquility Ct
- 43653 Serenity Ct
- 43749 San Francisco Ave
- 43730 San Francisco Ave
- 43823 Tranquility Ct
- 43824 Serenity Ct
- 43846 Tranquility Ct
- 43414 Tranquility Ct
- 2852 San Ramon Dr
- 43846 Estrella Ln
- 43938 Delgado Ct
- 3042 San Luis Dr
- 2203 Rosewood Ave
- 3057 Kilt Ct
- 43659 Ponderosa St
- 43625 Ponderosa St
- 3116 Peaceful Way
- 2330 E Avenue J 8 Unit 92
- 2330 E Avenue J 8 Unit 192
- 43619 27th St E
- 43603 27th St E
- 43612 Easy St
- 43618 Easy St
- 43625 27th St E
- 43608 Easy St
- 43610 27th St E
- 43616 27th St E
- 43626 Easy St
- 43600 27th St E
- 43622 27th St E
- 43633 27th St E
- 43607 Easy St
- 43630 27th St E
- 43634 Easy St
- 43617 Easy St
- 43621 La Paz Ln
- 43619 La Paz Ln
- 2717 E Avenue K
- 43636 27th St E
Your Personal Tour Guide
Ask me questions while you tour the home.