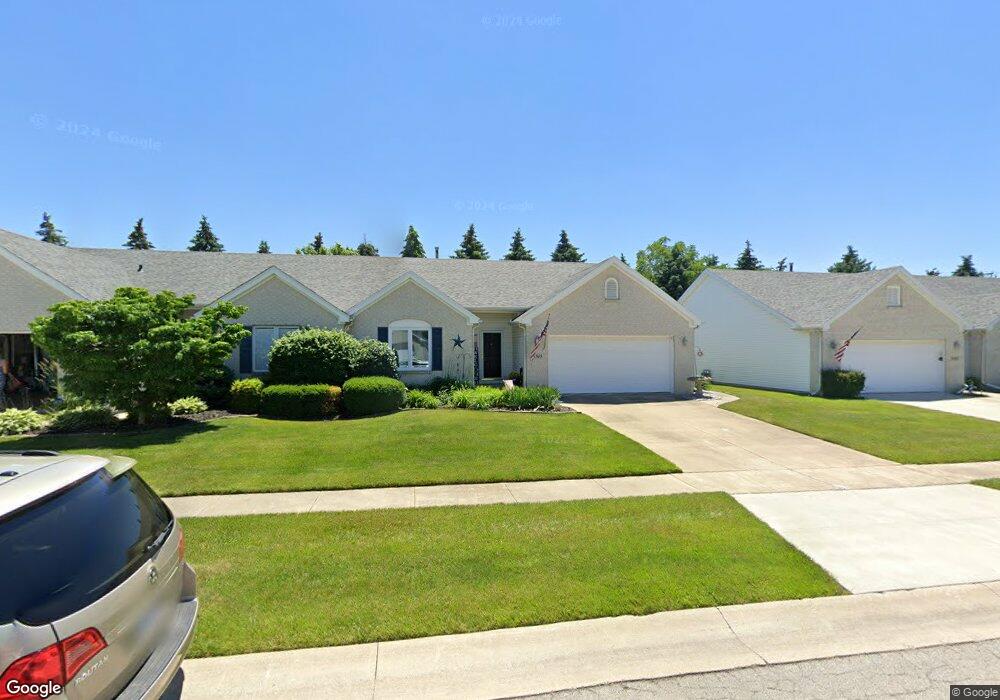
4363 S Watercrest Dr Toledo, OH 43614
Southwyck NeighborhoodEstimated Value: $214,344 - $247,000
2
Beds
2
Baths
1,326
Sq Ft
$177/Sq Ft
Est. Value
About This Home
This home is located at 4363 S Watercrest Dr, Toledo, OH 43614 and is currently estimated at $234,336, approximately $176 per square foot. 4363 S Watercrest Dr is a home located in Lucas County with nearby schools including Glendale-Feilbach Elementary School, Bowsher High School, and Northwest Ohio Classical Academy.
Ownership History
Date
Name
Owned For
Owner Type
Purchase Details
Closed on
Dec 2, 2009
Sold by
Fifth Third Bank
Bought by
Cisek Janet S
Current Estimated Value
Home Financials for this Owner
Home Financials are based on the most recent Mortgage that was taken out on this home.
Original Mortgage
$45,000
Interest Rate
5.05%
Mortgage Type
New Conventional
Purchase Details
Closed on
Jul 21, 2003
Sold by
Jacobson Gary H
Bought by
Fellhauer Judith A and Mills George L
Purchase Details
Closed on
Mar 13, 1998
Sold by
Mccarthy Builders Inc
Bought by
Jacobson Gary H and Jacobson Lynn A
Home Financials for this Owner
Home Financials are based on the most recent Mortgage that was taken out on this home.
Original Mortgage
$95,500
Interest Rate
6.12%
Mortgage Type
Construction
Create a Home Valuation Report for This Property
The Home Valuation Report is an in-depth analysis detailing your home's value as well as a comparison with similar homes in the area
Home Values in the Area
Average Home Value in this Area
Purchase History
| Date | Buyer | Sale Price | Title Company |
|---|---|---|---|
| Cisek Janet S | $125,000 | Attorney | |
| Fellhauer Judith A | $149,000 | -- | |
| Jacobson Gary H | $24,900 | Louisville Title Agency For |
Source: Public Records
Mortgage History
| Date | Status | Borrower | Loan Amount |
|---|---|---|---|
| Closed | Cisek Janet S | $45,000 | |
| Previous Owner | Jacobson Gary H | $95,500 |
Source: Public Records
Tax History Compared to Growth
Tax History
| Year | Tax Paid | Tax Assessment Tax Assessment Total Assessment is a certain percentage of the fair market value that is determined by local assessors to be the total taxable value of land and additions on the property. | Land | Improvement |
|---|---|---|---|---|
| 2024 | $1,298 | $52,150 | $6,755 | $45,395 |
| 2023 | $2,216 | $43,610 | $5,250 | $38,360 |
| 2022 | $2,235 | $43,610 | $5,250 | $38,360 |
| 2021 | $2,289 | $43,610 | $5,250 | $38,360 |
| 2020 | $2,374 | $40,845 | $9,345 | $31,500 |
| 2019 | $2,318 | $40,845 | $9,345 | $31,500 |
| 2018 | $2,324 | $40,845 | $9,345 | $31,500 |
| 2017 | $2,370 | $39,935 | $9,135 | $30,800 |
| 2016 | $2,357 | $114,100 | $26,100 | $88,000 |
| 2015 | $2,333 | $114,100 | $26,100 | $88,000 |
| 2014 | $1,961 | $39,940 | $9,140 | $30,800 |
| 2013 | $1,961 | $39,940 | $9,140 | $30,800 |
Source: Public Records
Map
Nearby Homes
- 4534 Heathercove Place
- 2451 Eastgate Rd
- 4796 Ryan Ridge Place
- 2017 Green Valley Dr
- 2158 Laurel Valley Dr
- 4237 Brogan Dr
- 1933 Woodlore Dr
- 2020 W Crest Dr
- 4501 Thackeray Rd
- 2155 Bishopsgate Dr
- 2566 Green Valley Dr
- 652 Mcintyre Ln
- 1553 Heather Meadow Dr
- 1733 Parkway Dr N
- 3770 Heatherdowns Blvd
- 1736 Parkway Dr N
- 1969 Oaklawn Dr
- 3950 Grandview Ct
- 1725 Parkway Dr S
- 1466 Wilderness Dr
- 4357 S Watercrest Dr
- 4353 S Watercrest Dr
- 4371 S Watercrest Dr
- 4528 Heathercove Place
- 4347 S Watercrest Dr
- 4522 Heathercove Place
- 4366 S Watercrest Dr
- 4356 S Watercrest Dr
- 4370 S Watercrest Dr
- 4375 S Watercrest Dr
- 4540 Heathercove Place
- 4354 S Watercrest Dr
- 4516 Heathercove Place
- 4343 S Watercrest Dr
- 4348 S Watercrest Dr
- 4379 S Watercrest Dr
- 4548 Heathercove Place
- 4548 Heathercove Place Unit 3
- 4344 S Watercrest Dr
- 4533 Heathercove Place