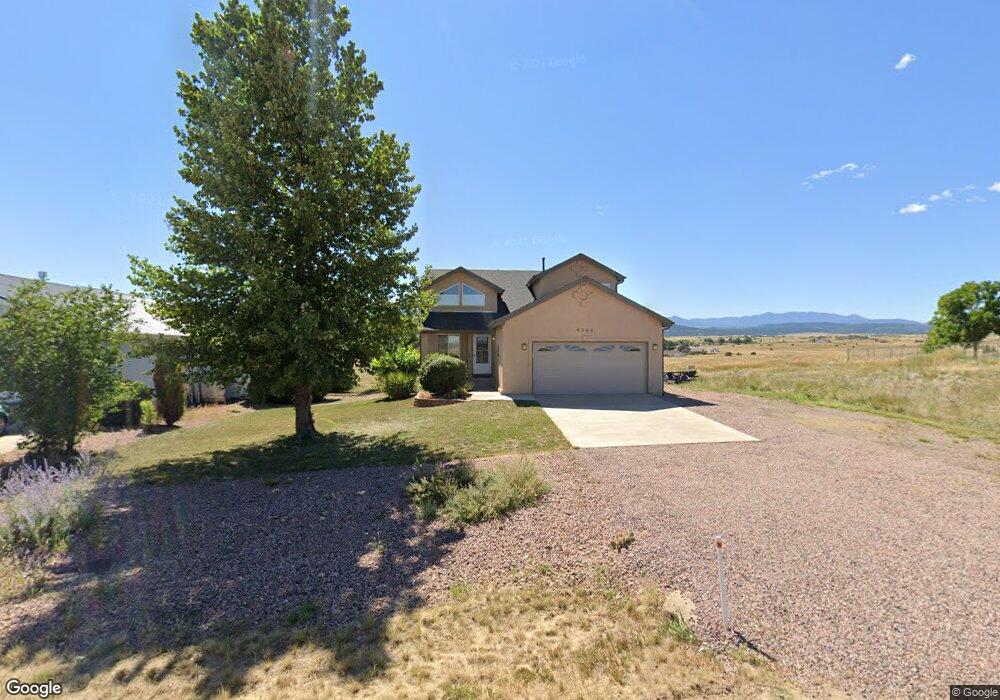
4364 E Jefferson Blvd Pueblo, CO 81004
Colorado City NeighborhoodEstimated Value: $433,000 - $513,000
4
Beds
3
Baths
982
Sq Ft
$470/Sq Ft
Est. Value
About This Home
This home is located at 4364 E Jefferson Blvd, Pueblo, CO 81004 and is currently estimated at $461,599, approximately $470 per square foot. 4364 E Jefferson Blvd is a home located in Pueblo County with nearby schools including Rye Elementary School, Craver Middle School, and Rye High School.
Ownership History
Date
Name
Owned For
Owner Type
Purchase Details
Closed on
Oct 13, 2021
Sold by
Ingraham Susan K
Bought by
North Cecily and Rudow Cody
Current Estimated Value
Home Financials for this Owner
Home Financials are based on the most recent Mortgage that was taken out on this home.
Original Mortgage
$419,000
Outstanding Balance
$382,089
Interest Rate
2.8%
Mortgage Type
New Conventional
Estimated Equity
$79,510
Purchase Details
Closed on
Feb 27, 2009
Sold by
Eagle West Homes Llc
Bought by
Ingraham Raymond C and Ingraham Susan K
Home Financials for this Owner
Home Financials are based on the most recent Mortgage that was taken out on this home.
Original Mortgage
$132,900
Interest Rate
4.92%
Mortgage Type
Purchase Money Mortgage
Purchase Details
Closed on
Aug 11, 2008
Sold by
Cook Rory and Cook Judith
Bought by
Eagle West Homes Llc
Create a Home Valuation Report for This Property
The Home Valuation Report is an in-depth analysis detailing your home's value as well as a comparison with similar homes in the area
Home Values in the Area
Average Home Value in this Area
Purchase History
| Date | Buyer | Sale Price | Title Company |
|---|---|---|---|
| North Cecily | $449,000 | Fidelity National Title | |
| Ingraham Raymond C | $189,900 | Land Title Guarantee Company | |
| Eagle West Homes Llc | $200,000 | None Available |
Source: Public Records
Mortgage History
| Date | Status | Borrower | Loan Amount |
|---|---|---|---|
| Open | North Cecily | $419,000 | |
| Previous Owner | Ingraham Raymond C | $132,900 |
Source: Public Records
Tax History Compared to Growth
Tax History
| Year | Tax Paid | Tax Assessment Tax Assessment Total Assessment is a certain percentage of the fair market value that is determined by local assessors to be the total taxable value of land and additions on the property. | Land | Improvement |
|---|---|---|---|---|
| 2024 | $3,250 | $28,810 | -- | -- |
| 2023 | $3,281 | $32,500 | $1,680 | $30,820 |
| 2022 | $1,806 | $15,770 | $1,180 | $14,590 |
| 2021 | $836 | $14,500 | $1,220 | $13,280 |
| 2020 | $1,918 | $17,990 | $1,220 | $16,770 |
| 2019 | $1,933 | $17,088 | $322 | $16,766 |
| 2018 | $1,593 | $14,046 | $324 | $13,722 |
| 2017 | $1,595 | $14,046 | $324 | $13,722 |
| 2016 | $1,529 | $13,488 | $358 | $13,130 |
| 2015 | $1,449 | $13,488 | $358 | $13,130 |
| 2014 | $1,465 | $13,676 | $358 | $13,318 |
Source: Public Records
Map
Nearby Homes
- 4364 E Jefferson Blvd
- Lot 1344 Brush Creek Dr
- Lot 1342 Brush Creek Dr
- Lot 1343 Brush Creek Dr
- TBD Yampa Dr
- 4480 Sandy Creek Dr
- 1122 Little Snake Dr
- Lot 1413 Sandy Creek Dr
- 3017 Lunar Dr
- 49 N Pkwy
- 0 Las Animas Way Unit 234006
- Lot 1098 Plum Creek Way
- Lot 1099 Plum Creek Way
- Lot 1100 Plum Creek Way
- 3980 E Colorado Blvd
- 2970 Blue Spruce Dr
- 2871 Blue Spruce Dr
- Lot 865 White River Ln Unit 4618214292
- Lot 865 White River Ln
- TBD Plum Creek Way
- 4364 E Jefferson Blvd Unit 14
- 4364 E Jefferson Blvd Unit 1287
- 4348 E Jefferson Blvd
- 4361 Jefferson Blvd Unit 742
- 4396 E Jefferson Blvd
- 4332 E Jefferson Blvd
- 4316 E Jefferson Blvd
- 4321 E Jefferson Blvd
- 4419 W Jefferson Blvd
- 4419 W Jefferson Blvd Unit 498
- 4420 E Jefferson Blvd
- 4432 E Jefferson Blvd Unit 1282
- 4432 E Jefferson Blvd
- 4300 E Jefferson Blvd
- 4444 E Jefferson Blvd Unit 1281
- 4454 Jefferson Blvd Unit 489
- 4820 E Jefferson Blvd
- 4400 W Jefferson Blvd Unit 497
- 4214 Ouray St
- 4464 Jefferson Blvd Unit 489