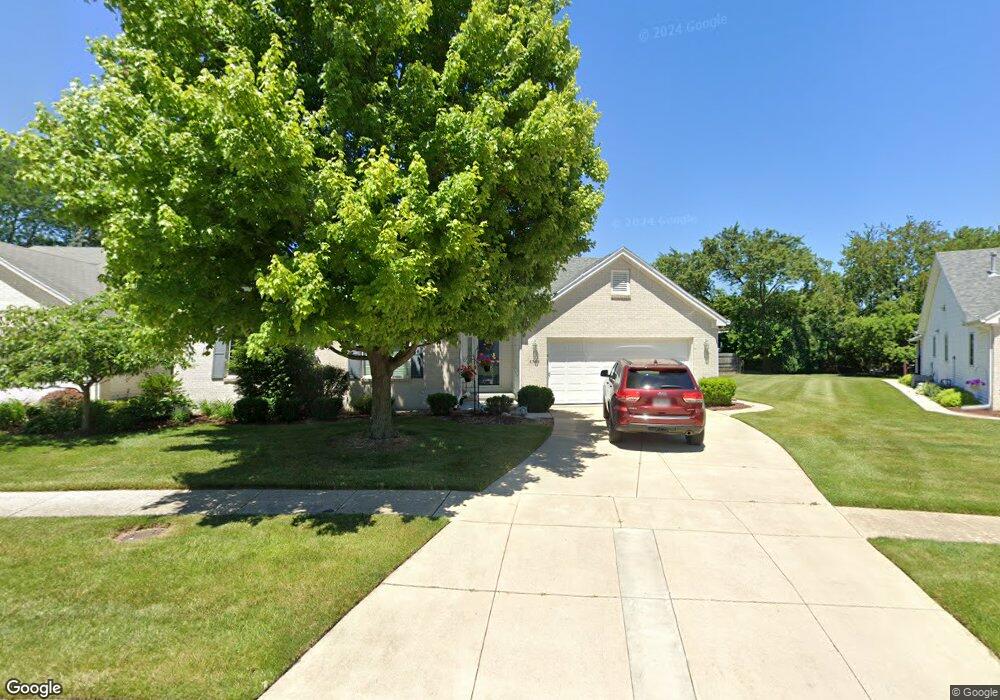
4364 N Watercrest Dr Toledo, OH 43614
Southwyck NeighborhoodEstimated Value: $203,000 - $231,000
2
Beds
2
Baths
1,347
Sq Ft
$163/Sq Ft
Est. Value
About This Home
This home is located at 4364 N Watercrest Dr, Toledo, OH 43614 and is currently estimated at $219,245, approximately $162 per square foot. 4364 N Watercrest Dr is a home located in Lucas County with nearby schools including Glendale-Feilbach Elementary School, Bowsher High School, and Northwest Ohio Classical Academy.
Ownership History
Date
Name
Owned For
Owner Type
Purchase Details
Closed on
Apr 4, 2025
Sold by
Bahler Family Trust and Mason Bonnie S
Bought by
Mason Bonnie S
Current Estimated Value
Purchase Details
Closed on
Nov 17, 2014
Sold by
Trudell Frederick
Bought by
Bahler Family Trust and Bahler Leona M
Purchase Details
Closed on
Mar 3, 1999
Sold by
Hall Kelly A
Bought by
Trudell Frederick and Trudell Norma G
Home Financials for this Owner
Home Financials are based on the most recent Mortgage that was taken out on this home.
Original Mortgage
$45,000
Interest Rate
6.78%
Purchase Details
Closed on
Oct 28, 1997
Sold by
Mccarthy Builders Inc
Bought by
Hall Kelly A
Home Financials for this Owner
Home Financials are based on the most recent Mortgage that was taken out on this home.
Original Mortgage
$109,600
Interest Rate
6.25%
Mortgage Type
New Conventional
Create a Home Valuation Report for This Property
The Home Valuation Report is an in-depth analysis detailing your home's value as well as a comparison with similar homes in the area
Home Values in the Area
Average Home Value in this Area
Purchase History
| Date | Buyer | Sale Price | Title Company |
|---|---|---|---|
| Mason Bonnie S | -- | Fallen Timbers Title | |
| Bahler Family Trust | $112,000 | None Available | |
| Trudell Frederick | $135,500 | Northwest Title Agency Of Oh | |
| Hall Kelly A | $24,900 | -- |
Source: Public Records
Mortgage History
| Date | Status | Borrower | Loan Amount |
|---|---|---|---|
| Previous Owner | Trudell Frederick | $45,000 | |
| Previous Owner | Hall Kelly A | $109,600 |
Source: Public Records
Tax History Compared to Growth
Tax History
| Year | Tax Paid | Tax Assessment Tax Assessment Total Assessment is a certain percentage of the fair market value that is determined by local assessors to be the total taxable value of land and additions on the property. | Land | Improvement |
|---|---|---|---|---|
| 2024 | $1,347 | $54,355 | $6,895 | $47,460 |
| 2023 | $2,279 | $45,115 | $5,425 | $39,690 |
| 2022 | $2,300 | $45,115 | $5,425 | $39,690 |
| 2021 | $2,358 | $45,115 | $5,425 | $39,690 |
| 2020 | $2,408 | $41,755 | $9,730 | $32,025 |
| 2019 | $2,353 | $41,755 | $9,730 | $32,025 |
| 2018 | $2,358 | $41,755 | $9,730 | $32,025 |
| 2017 | $2,407 | $40,810 | $9,520 | $31,290 |
| 2016 | $2,390 | $116,600 | $27,200 | $89,400 |
| 2015 | $2,365 | $116,600 | $27,200 | $89,400 |
| 2014 | $2,016 | $40,810 | $9,520 | $31,290 |
| 2013 | $2,016 | $40,810 | $9,520 | $31,290 |
Source: Public Records
Map
Nearby Homes
- 4534 Heathercove Place
- 2451 Eastgate Rd
- 4796 Ryan Ridge Place
- 2017 Green Valley Dr
- 1933 Woodlore Dr
- 2158 Laurel Valley Dr
- 2020 W Crest Dr
- 2155 Bishopsgate Dr
- 4237 Brogan Dr
- 1553 Heather Meadow Dr
- 2566 Green Valley Dr
- 3950 Grandview Ct
- 1969 Oaklawn Dr
- 3770 Heatherdowns Blvd
- 4501 Thackeray Rd
- 652 Mcintyre Ln
- 3651 Treelawn Dr
- 3679 Elmlawn Dr
- 1733 Parkway Dr N
- 1736 Parkway Dr N
- 4368 N Watercrest Dr
- 4360 N Watercrest Dr
- 4358 N Watercrest Dr
- 4339 Pacquin Ln
- 4378 N Watercrest Dr
- 4369 N Watercrest Dr
- 4331 Pacquin Ln
- 4353 Pacquin Ln
- 4350 N Watercrest Dr
- 4355 N Watercrest Dr
- 4373 N Watercrest Dr
- 4346 N Watercrest Dr
- 4325 Pacquin Ln
- 4384 N Watercrest Dr
- 2226 Eastgate Rd
- 4345 N Watercrest Dr
- 4388 N Watercrest Dr
- 2311 N Watercrest Dr
- 2175 Blackthorn Dr
- 2226 Blackthorn Dr