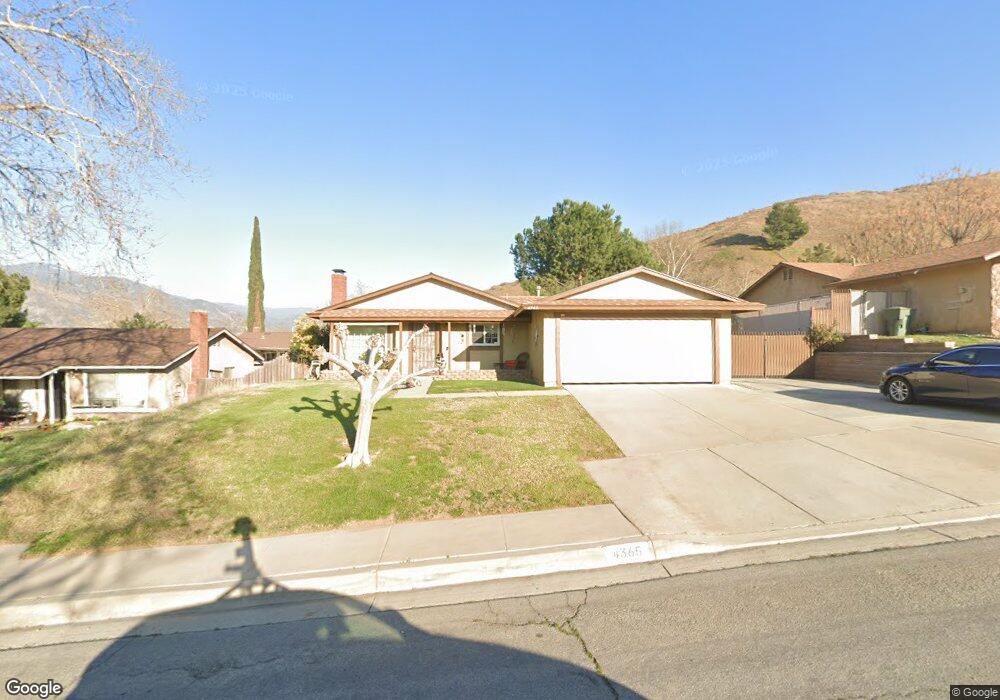
4365 Syracuse Dr San Bernardino, CA 92407
Hudson Park NeighborhoodEstimated Value: $458,000 - $530,000
3
Beds
2
Baths
1,066
Sq Ft
$454/Sq Ft
Est. Value
About This Home
This home is located at 4365 Syracuse Dr, San Bernardino, CA 92407 and is currently estimated at $484,257, approximately $454 per square foot. 4365 Syracuse Dr is a home located in San Bernardino County with nearby schools including Kendall Elementary School, Shandin Hills Middle School, and Cajon High School.
Ownership History
Date
Name
Owned For
Owner Type
Purchase Details
Closed on
Mar 6, 2017
Sold by
Rose Charles F and Rose Ruth V
Bought by
Revocabl Charles Rose and Revocabl Ruth Vargas Rose
Current Estimated Value
Purchase Details
Closed on
Aug 7, 1996
Sold by
Trechter Christopher C
Bought by
Vargas Rose Charles F and Vargas Rose Ruth
Home Financials for this Owner
Home Financials are based on the most recent Mortgage that was taken out on this home.
Original Mortgage
$88,896
Interest Rate
8.23%
Mortgage Type
FHA
Purchase Details
Closed on
Aug 1, 1996
Sold by
Trechter Kevin H
Bought by
Trechter Christopher C
Home Financials for this Owner
Home Financials are based on the most recent Mortgage that was taken out on this home.
Original Mortgage
$88,896
Interest Rate
8.23%
Mortgage Type
FHA
Create a Home Valuation Report for This Property
The Home Valuation Report is an in-depth analysis detailing your home's value as well as a comparison with similar homes in the area
Home Values in the Area
Average Home Value in this Area
Purchase History
| Date | Buyer | Sale Price | Title Company |
|---|---|---|---|
| Revocabl Charles Rose | -- | None Available | |
| Vargas Rose Charles F | $90,500 | Continental Lawyers Title Co | |
| Trechter Kevin H | -- | Continental Lawyers Title Co | |
| Trechter Christopher C | -- | -- |
Source: Public Records
Mortgage History
| Date | Status | Borrower | Loan Amount |
|---|---|---|---|
| Previous Owner | Vargas Rose Charles F | $88,896 |
Source: Public Records
Tax History Compared to Growth
Tax History
| Year | Tax Paid | Tax Assessment Tax Assessment Total Assessment is a certain percentage of the fair market value that is determined by local assessors to be the total taxable value of land and additions on the property. | Land | Improvement |
|---|---|---|---|---|
| 2025 | $2,071 | $162,368 | $42,343 | $120,025 |
| 2024 | $2,071 | $159,185 | $41,513 | $117,672 |
| 2023 | $2,017 | $156,064 | $40,699 | $115,365 |
| 2022 | $2,016 | $153,004 | $39,901 | $113,103 |
| 2021 | $2,016 | $150,004 | $39,119 | $110,885 |
| 2020 | $2,017 | $148,466 | $38,718 | $109,748 |
| 2019 | $1,958 | $145,555 | $37,959 | $107,596 |
| 2018 | $1,935 | $142,701 | $37,215 | $105,486 |
| 2017 | $1,874 | $139,903 | $36,485 | $103,418 |
| 2016 | $1,816 | $137,160 | $35,770 | $101,390 |
| 2015 | $1,698 | $135,100 | $35,233 | $99,867 |
| 2014 | $1,649 | $132,454 | $34,543 | $97,911 |
Source: Public Records
Map
Nearby Homes
- 1594 Morgan Rd
- 1548 Teton St
- 4729 Windsor Ct
- 1511 Yardley St
- 1559 Wild Pony Path
- 10 Kendall Dr
- 1503 Indian Trail
- 4872 Cambridge Ave
- 1805 Clemson St
- 4834 Alta Dr
- 5011 Citadel Ave
- 5205 N Mammoth Dr
- 1380 W 48th St Unit 30
- 4905 Village Green Way
- 1265 Kendall Dr Unit 723
- 1265 Kendall Dr
- 1265 Kendall Dr Unit 811
- 1265 Kendall Dr Unit 6I5
- 5491 Pinnacle Ln
- 5294 Sundance Dr
- 4335 Syracuse Dr
- 4395 Syracuse Dr
- 4364 Pepperdine Dr
- 4394 Pepperdine Dr
- 4334 Pepperdine Dr
- 4405 Syracuse Dr
- 4305 Syracuse Dr
- 4364 Syracuse Dr
- 4404 Pepperdine Dr
- 4334 Syracuse Dr
- 4394 Syracuse Dr
- 4304 Pepperdine Dr
- 4404 Syracuse Dr
- 4304 Syracuse Dr
- 4435 Syracuse Dr
- 4434 Pepperdine Dr
- 4365 Lakewood Dr
- 4434 Syracuse Dr
- 4351 Pepperdine Dr
- 4395 Lakewood Dr