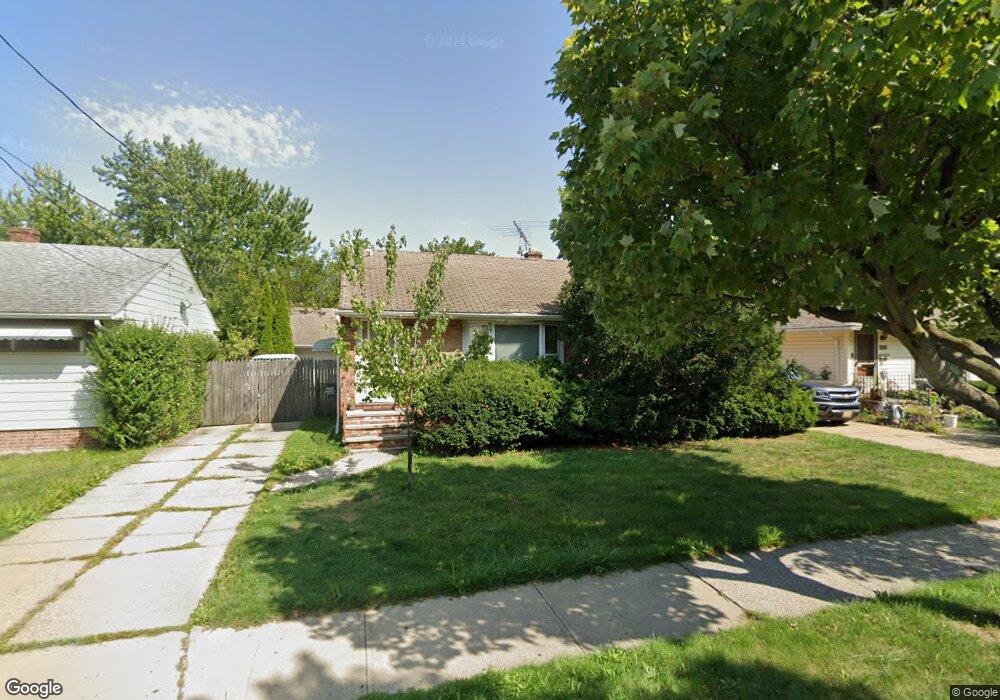
4365 W 155th St Cleveland, OH 44135
Jefferson NeighborhoodEstimated Value: $135,515 - $174,000
3
Beds
1
Bath
936
Sq Ft
$170/Sq Ft
Est. Value
About This Home
This home is located at 4365 W 155th St, Cleveland, OH 44135 and is currently estimated at $158,879, approximately $169 per square foot. 4365 W 155th St is a home located in Cuyahoga County with nearby schools including Artemus Ward School, Almira Academy, and Benjamin Franklin.
Ownership History
Date
Name
Owned For
Owner Type
Purchase Details
Closed on
Apr 28, 2012
Sold by
Martinsek Emil R and Martinsek Denise M
Bought by
Martinsek Stephen
Current Estimated Value
Purchase Details
Closed on
Apr 22, 2012
Sold by
Dematteo Elizabeth A and Dematteo Arthur E
Bought by
Martinsek Stephen
Purchase Details
Closed on
Apr 9, 2012
Sold by
Martinsek Matthew and Martinsek Deborah
Bought by
Martinsek Stephen
Purchase Details
Closed on
Mar 26, 2012
Sold by
Boles Margaret M and Boles Guy R
Bought by
Martinsek Stephen
Purchase Details
Closed on
Mar 10, 2012
Sold by
Martinsek Ralph and Martinsek Patsy E
Bought by
Martinsek Stephen
Purchase Details
Closed on
Mar 24, 1994
Sold by
Martinsek Emil R
Bought by
Boles Margaret M
Purchase Details
Closed on
Jun 3, 1993
Sold by
Martinsek Emil R
Bought by
Martinsek Emil R
Purchase Details
Closed on
Jun 18, 1987
Sold by
Martinsek Emil R and Martinsek Helen D
Bought by
Martinsek Emil R
Purchase Details
Closed on
Jan 1, 1975
Bought by
Martinsek Emil R and Martinsek Helen D
Create a Home Valuation Report for This Property
The Home Valuation Report is an in-depth analysis detailing your home's value as well as a comparison with similar homes in the area
Home Values in the Area
Average Home Value in this Area
Purchase History
| Date | Buyer | Sale Price | Title Company |
|---|---|---|---|
| Martinsek Stephen | -- | Attorney | |
| Martinsek Stephen | -- | Attorney | |
| Martinsek Stephen | -- | Attorney | |
| Martinsek Stephen | -- | Attorney | |
| Martinsek Stephen | -- | Attorney | |
| Boles Margaret M | -- | -- | |
| Martinsek Emil R | -- | -- | |
| Martinsek Emil R | -- | -- | |
| Martinsek Emil R | -- | -- |
Source: Public Records
Tax History Compared to Growth
Tax History
| Year | Tax Paid | Tax Assessment Tax Assessment Total Assessment is a certain percentage of the fair market value that is determined by local assessors to be the total taxable value of land and additions on the property. | Land | Improvement |
|---|---|---|---|---|
| 2024 | $2,338 | $35,665 | $7,770 | $27,895 |
| 2023 | $1,885 | $24,850 | $5,600 | $19,250 |
| 2022 | $1,874 | $24,850 | $5,600 | $19,250 |
| 2021 | $1,855 | $24,850 | $5,600 | $19,250 |
| 2020 | $1,662 | $19,250 | $4,340 | $14,910 |
| 2019 | $1,537 | $55,000 | $12,400 | $42,600 |
| 2018 | $1,298 | $19,250 | $4,340 | $14,910 |
| 2017 | $1,577 | $19,120 | $3,470 | $15,650 |
| 2016 | $1,564 | $19,120 | $3,470 | $15,650 |
| 2015 | $1,707 | $19,120 | $3,470 | $15,650 |
| 2014 | $1,707 | $20,790 | $3,780 | $17,010 |
Source: Public Records
Map
Nearby Homes
- 15617 Mina Ave
- 4484 W 149th St
- 4571 W 157th St
- 4267 W 162nd St
- 4497 W 147th St
- 16312 Laverne Ave
- 4636 W 157th St
- 14511 Saint James Ave
- 16701 Elsienna Ave
- 4695 W 152nd St
- 4096 W 161st St
- 4049 W 157th St
- 4704 W 150th St
- 16605 Sedalia Ave
- 4688 W 148th St
- 16717 Valleyview Ave
- 4413 W 173rd St
- 14434 Cleminshaw Rd
- 14513 Mission Rd
- 4407 W 140th St
- 4361 W 155th St
- 4371 W 155th St
- 4355 W 155th St
- 4377 W 155th St
- 4351 W 155th St
- 4383 W 155th St
- 4366 W 155th St
- 4372 W 155th St
- 4380 W 155th St
- 4356 W 155th St
- 4345 W 155th St
- 4389 W 155th St
- 4352 W 155th St
- 15219 Aldene Ave
- 4384 W 155th St
- 4341 W 155th St
- 4393 W 155th St
- 4346 W 155th St
- 4388 W 155th St
- 15215 Aldene Ave