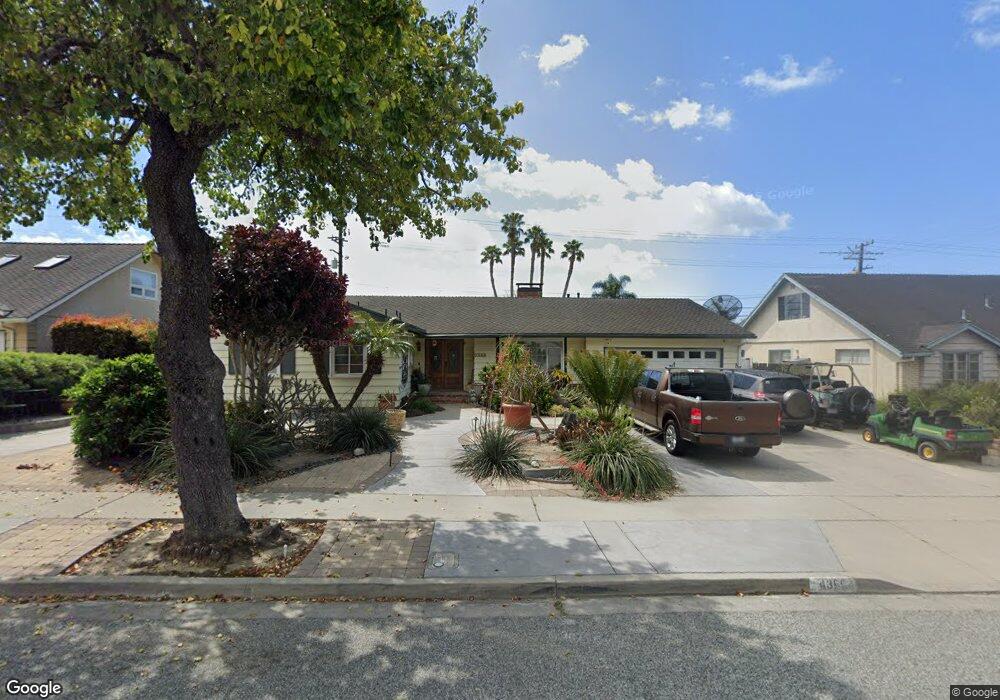
4366 Hope St Ventura, CA 93003
College NeighborhoodEstimated Value: $1,115,764 - $1,154,000
4
Beds
4
Baths
1,900
Sq Ft
$598/Sq Ft
Est. Value
About This Home
This home is located at 4366 Hope St, Ventura, CA 93003 and is currently estimated at $1,136,691, approximately $598 per square foot. 4366 Hope St is a home located in Ventura County with nearby schools including Loma Vista Elementary School, Cabrillo Middle School, and Ventura High School.
Ownership History
Date
Name
Owned For
Owner Type
Purchase Details
Closed on
Apr 20, 2020
Sold by
Becerra Peter John and Becerra Peter J
Bought by
Becerra Peter John
Current Estimated Value
Home Financials for this Owner
Home Financials are based on the most recent Mortgage that was taken out on this home.
Original Mortgage
$489,500
Outstanding Balance
$432,814
Interest Rate
3.3%
Mortgage Type
New Conventional
Estimated Equity
$703,877
Purchase Details
Closed on
Jul 31, 2009
Sold by
Becerra Danielle R
Bought by
Becerra Peter J
Purchase Details
Closed on
Aug 25, 2006
Sold by
Roecker Mildred J
Bought by
Becerra Peter John and Becerra Danielle Renee
Home Financials for this Owner
Home Financials are based on the most recent Mortgage that was taken out on this home.
Original Mortgage
$508,000
Interest Rate
7.62%
Mortgage Type
Purchase Money Mortgage
Purchase Details
Closed on
Mar 11, 1998
Sold by
Mildred Roecker
Bought by
Roecker Mildred J
Create a Home Valuation Report for This Property
The Home Valuation Report is an in-depth analysis detailing your home's value as well as a comparison with similar homes in the area
Home Values in the Area
Average Home Value in this Area
Purchase History
| Date | Buyer | Sale Price | Title Company |
|---|---|---|---|
| Becerra Peter John | -- | Fidelity National Title | |
| Becerra Peter J | -- | None Available | |
| Becerra Peter John | $635,000 | First American Title Company | |
| Roecker Mildred J | -- | -- |
Source: Public Records
Mortgage History
| Date | Status | Borrower | Loan Amount |
|---|---|---|---|
| Open | Becerra Peter John | $489,500 | |
| Closed | Becerra Peter John | $508,000 |
Source: Public Records
Tax History
| Year | Tax Paid | Tax Assessment Tax Assessment Total Assessment is a certain percentage of the fair market value that is determined by local assessors to be the total taxable value of land and additions on the property. | Land | Improvement |
|---|---|---|---|---|
| 2025 | $9,156 | $850,753 | $553,328 | $297,425 |
| 2024 | $9,156 | $834,072 | $542,478 | $291,594 |
| 2023 | $9,053 | $817,718 | $531,841 | $285,877 |
| 2022 | $8,412 | $801,685 | $521,413 | $280,272 |
| 2021 | $8,268 | $785,966 | $511,189 | $274,777 |
| 2020 | $8,007 | $760,000 | $496,000 | $264,000 |
| 2019 | $7,653 | $725,000 | $473,000 | $252,000 |
| 2018 | $7,361 | $695,000 | $453,000 | $242,000 |
| 2017 | $7,295 | $688,000 | $448,000 | $240,000 |
| 2016 | $7,069 | $665,000 | $433,000 | $232,000 |
| 2015 | $6,654 | $626,000 | $408,000 | $218,000 |
| 2014 | $6,134 | $573,000 | $373,000 | $200,000 |
Source: Public Records
Map
Nearby Homes
- 4256 Gettysburg St
- 379 Mcgill Ave
- 4725 Loma Vista Rd
- 4797 Loma Vista Rd
- 366 Court Ave
- 3975 Telegraph Rd Unit 2
- 69 University Ave
- 3880 Loma Vista Rd
- 437 Court Ave
- 218 Palomares Ave
- 386 Dorothy Ave
- 194 Dean Ct
- 3940 Foothill Rd
- 3750 Mound Ave
- 71 College Dr
- 4648 Dean Dr
- 3662 Loma Vista Rd
- 127 Glen Ellen Dr
- 281 Glen Ellen Dr
- 3637 Dean Dr
Your Personal Tour Guide
Ask me questions while you tour the home.