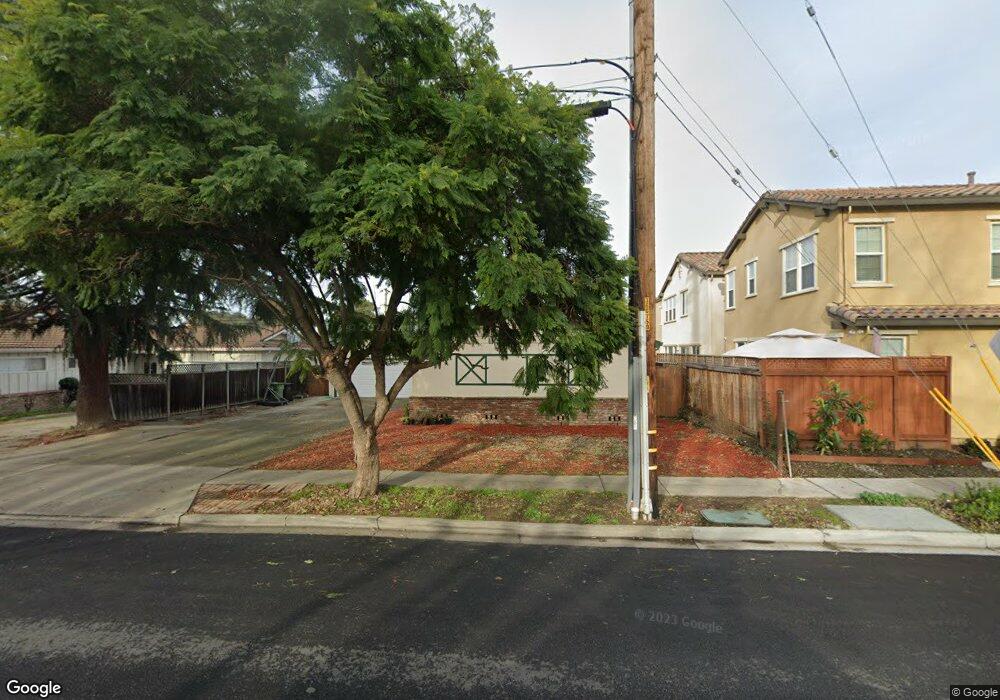
4367 Alder Ave Fremont, CA 94536
Estimated Value: $1,433,000 - $2,061,000
3
Beds
2
Baths
1,766
Sq Ft
$988/Sq Ft
Est. Value
About This Home
This home is located at 4367 Alder Ave, Fremont, CA 94536 and is currently estimated at $1,744,175, approximately $987 per square foot. 4367 Alder Ave is a home located in Alameda County with nearby schools including Oliveira Elementary School, Thornton Middle School, and American High School.
Ownership History
Date
Name
Owned For
Owner Type
Purchase Details
Closed on
Sep 6, 2012
Sold by
Ming Wong Samuel and Ming Wong Samual
Bought by
Ming Wong Samuel
Current Estimated Value
Home Financials for this Owner
Home Financials are based on the most recent Mortgage that was taken out on this home.
Original Mortgage
$346,500
Outstanding Balance
$238,630
Interest Rate
3.47%
Mortgage Type
New Conventional
Estimated Equity
$1,505,545
Purchase Details
Closed on
Oct 21, 2002
Sold by
Galli Michael D and Galli Dawn R
Bought by
Ming Wong Samual
Home Financials for this Owner
Home Financials are based on the most recent Mortgage that was taken out on this home.
Original Mortgage
$400,000
Interest Rate
6.09%
Purchase Details
Closed on
Sep 26, 1995
Sold by
Galli Beth Rae
Bought by
Galli Michael D
Create a Home Valuation Report for This Property
The Home Valuation Report is an in-depth analysis detailing your home's value as well as a comparison with similar homes in the area
Home Values in the Area
Average Home Value in this Area
Purchase History
| Date | Buyer | Sale Price | Title Company |
|---|---|---|---|
| Ming Wong Samuel | -- | Chicago Title Company | |
| Ming Wong Samual | $510,000 | -- | |
| Galli Michael D | -- | -- |
Source: Public Records
Mortgage History
| Date | Status | Borrower | Loan Amount |
|---|---|---|---|
| Open | Ming Wong Samuel | $346,500 | |
| Closed | Ming Wong Samual | $400,000 |
Source: Public Records
Tax History Compared to Growth
Tax History
| Year | Tax Paid | Tax Assessment Tax Assessment Total Assessment is a certain percentage of the fair market value that is determined by local assessors to be the total taxable value of land and additions on the property. | Land | Improvement |
|---|---|---|---|---|
| 2025 | $8,944 | $731,581 | $221,574 | $517,007 |
| 2024 | $8,944 | $717,102 | $217,230 | $506,872 |
| 2023 | $8,701 | $709,908 | $212,972 | $496,936 |
| 2022 | $8,584 | $688,991 | $208,797 | $487,194 |
| 2021 | $8,373 | $675,348 | $204,704 | $477,644 |
| 2020 | $8,383 | $675,357 | $202,607 | $472,750 |
| 2019 | $8,287 | $662,117 | $198,635 | $463,482 |
| 2018 | $8,124 | $649,137 | $194,741 | $454,396 |
| 2017 | $7,920 | $636,413 | $190,924 | $445,489 |
| 2016 | $7,783 | $623,938 | $187,181 | $436,757 |
| 2015 | $7,677 | $614,570 | $184,371 | $430,199 |
| 2014 | $7,543 | $602,534 | $180,760 | $421,774 |
Source: Public Records
Map
Nearby Homes
- 4412 Elaiso Common
- 4543 Bartolo Terrace
- 4632 Balboa Way
- 37001 Contra Costa Ave
- 36304 Magellan Dr
- 36521 Cabrillo Dr
- 4544 Thornton Ave
- 36347 Magellan Dr
- 35942 Adobe Dr
- 4637 Rothbury Common
- 3751 Ruskin Place
- 35978 Magellan Dr
- 4626 Alhambra Dr
- 36139 San Pedro Dr
- 35936 Magellan Dr
- 35856 Adobe Dr
- 4955 Swindon Place
- 36202 Worthing Dr
- 37114 Dondero Way
- 36288 Saxon Ct
- 4373 Alder Ave
- 36414 Calabria Common
- 36408 Calabria Common
- 36420 Calabria Common
- 4360 Torres Ave
- 4337 Tauro Terrace
- 4368 Torres Ave
- 36505 Nasa Terrace
- 36449 Calabria Common
- 4338 Tauro Terrace
- 4395 Alder Ave
- 36491 Calabria Common
- 36506 Bedelio Terrace
- 36509 Nasa Terrace
- 4376 Torres Ave
- 4325 Alder Ave
- 36504 Nasa Terrace
- 4331 Tauro Terrace
- 36455 Calabria Common
- 4332 Tauro Terrace