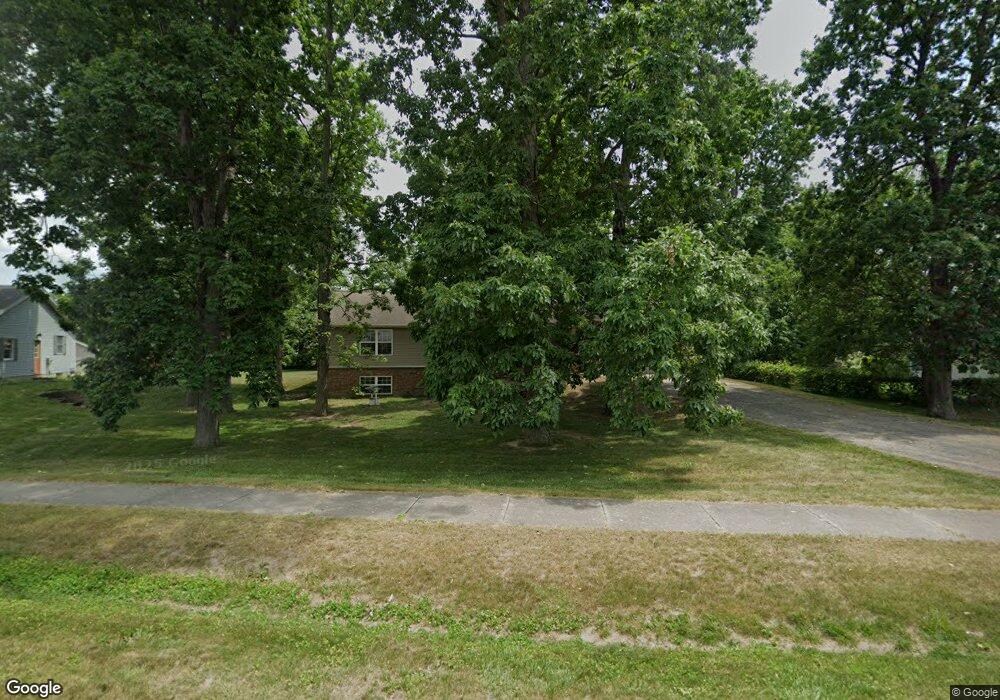
4367 Chappel St Wayland, MI 49348
Estimated Value: $286,000 - $357,000
3
Beds
2
Baths
1,566
Sq Ft
$209/Sq Ft
Est. Value
About This Home
This home is located at 4367 Chappel St, Wayland, MI 49348 and is currently estimated at $327,140, approximately $208 per square foot. 4367 Chappel St is a home located in Allegan County with nearby schools including Wayland High School and Moline Christian School.
Ownership History
Date
Name
Owned For
Owner Type
Purchase Details
Closed on
Jun 20, 2022
Sold by
Anthony Dekok Stephen
Bought by
Stephen A Dekok Living Trust
Current Estimated Value
Purchase Details
Closed on
Oct 21, 2008
Sold by
Zudweg Donald and Zudweg Joyce
Bought by
Rookus Joyce E and Joyce Rookus Trust #1
Purchase Details
Closed on
May 3, 2007
Sold by
Rookus John and Rookus Joyce E
Bought by
The Joyce E Rookus Trust #1
Home Financials for this Owner
Home Financials are based on the most recent Mortgage that was taken out on this home.
Original Mortgage
$136,000
Interest Rate
6.27%
Mortgage Type
New Conventional
Purchase Details
Closed on
Apr 13, 2006
Sold by
Rookus Joyce E
Bought by
Zudweg Donald and Zudweg Joyce
Home Financials for this Owner
Home Financials are based on the most recent Mortgage that was taken out on this home.
Original Mortgage
$179,000
Interest Rate
6.5%
Mortgage Type
Seller Take Back
Purchase Details
Closed on
Jul 22, 1999
Bought by
Rookus John and Rookus Joyce
Create a Home Valuation Report for This Property
The Home Valuation Report is an in-depth analysis detailing your home's value as well as a comparison with similar homes in the area
Home Values in the Area
Average Home Value in this Area
Purchase History
| Date | Buyer | Sale Price | Title Company |
|---|---|---|---|
| Stephen A Dekok Living Trust | -- | None Listed On Document | |
| Rookus Joyce E | -- | None Available | |
| The Joyce E Rookus Trust #1 | -- | None Available | |
| Rookus John | -- | None Available | |
| Zudweg Donald | $179,000 | None Available | |
| Rookus John | $21,900 | -- |
Source: Public Records
Mortgage History
| Date | Status | Borrower | Loan Amount |
|---|---|---|---|
| Previous Owner | Rookus John | $136,000 | |
| Previous Owner | Zudweg Donald | $179,000 |
Source: Public Records
Tax History Compared to Growth
Tax History
| Year | Tax Paid | Tax Assessment Tax Assessment Total Assessment is a certain percentage of the fair market value that is determined by local assessors to be the total taxable value of land and additions on the property. | Land | Improvement |
|---|---|---|---|---|
| 2025 | $4,778 | $169,500 | $43,100 | $126,400 |
| 2024 | $2,817 | $162,100 | $33,400 | $128,700 |
| 2023 | $3,671 | $141,700 | $29,900 | $111,800 |
| 2022 | $2,817 | $123,600 | $28,400 | $95,200 |
| 2021 | $4,188 | $118,200 | $28,400 | $89,800 |
| 2020 | $4,017 | $95,400 | $16,400 | $79,000 |
| 2019 | $4,017 | $89,800 | $16,400 | $73,400 |
| 2018 | $3,921 | $87,700 | $13,500 | $74,200 |
| 2017 | $0 | $93,500 | $13,500 | $80,000 |
| 2016 | $0 | $85,900 | $13,500 | $72,400 |
| 2015 | -- | $85,900 | $13,500 | $72,400 |
| 2014 | -- | $78,800 | $14,000 | $64,800 |
| 2013 | -- | $74,400 | $14,000 | $60,400 |
Source: Public Records
Map
Nearby Homes
- 4351 Hickory View Ct
- 4335 Tavistock Dr
- 4316 Sussex Place
- Lot 11 Walnut Dale Dr
- 4273 Highpoint Dr Unit 112
- Unit 111 Highpoint Dr
- 4274 Butternut Dr
- Lot 142 Butternut Dr
- Lot 141 Butternut Dr
- 4240 Butternut Dr
- Vienna Plan at Harvest Meadows
- Charlotte Plan at Harvest Meadows
- Sierra Plan at Harvest Meadows
- Karolynn Plan at Harvest Meadows
- Reno Plan at Harvest Meadows
- Bayberry Plan at Harvest Meadows
- Freedom Plan at Harvest Meadows
- London Plan at Harvest Meadows
- Hampton Plan at Harvest Meadows
- Oxford Plan at Harvest Meadows
- 4367 Chappel St
- 4369 Chappel St
- 4363 Chappel St
- 4371 Chapel Ct
- 4372 Hickory View Ct
- 4376 Hickory View Ct
- 4368 Hickory View Ct
- 1240 Hillcrest Dr
- 4366 Chappell
- 4380 Hickory View Ct
- 4379 Chappel St
- 4364 Hickory View Ct
- 1236 Hillcrest Dr
- 4343 Hickory View Ct
- 1225 Rosewood St
- 4370 Chappel St
- 1240 Hillcrest Dr
- 4360 Hickory View Ct
- 4384 Hickory View Ct
- 4363 Hickory View Ct