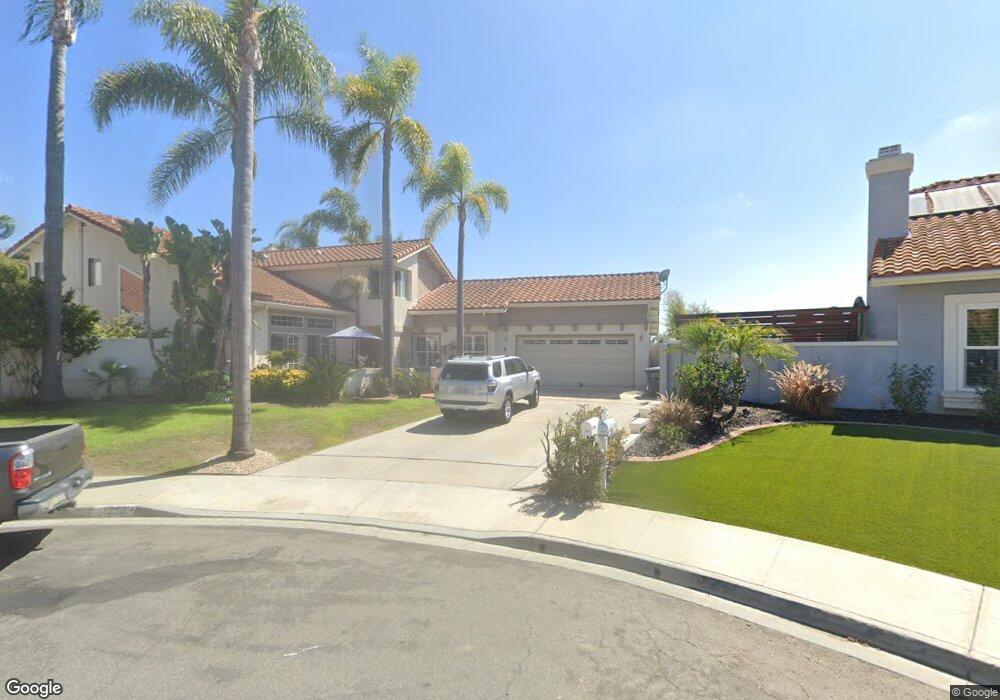
4368 Point Reyes Ct Carlsbad, CA 92010
Tamarack Point NeighborhoodEstimated Value: $1,604,000 - $1,816,000
4
Beds
3
Baths
2,993
Sq Ft
$568/Sq Ft
Est. Value
About This Home
This home is located at 4368 Point Reyes Ct, Carlsbad, CA 92010 and is currently estimated at $1,699,264, approximately $567 per square foot. 4368 Point Reyes Ct is a home located in San Diego County with nearby schools including Hope Elementary School, Calavera Hills Middle, and Carlsbad High School.
Ownership History
Date
Name
Owned For
Owner Type
Purchase Details
Closed on
Jul 25, 2025
Sold by
Kim Michael Gene and Kim Megan Jean
Bought by
Kim Family Trust and Kim
Current Estimated Value
Purchase Details
Closed on
May 18, 2012
Sold by
Goble Mary T and Goble John G
Bought by
Kim Michael G and Kim Megan J
Purchase Details
Closed on
Oct 25, 2008
Sold by
Goble John G and Goble Mary T
Bought by
Goble Mary T and Goble John G
Home Financials for this Owner
Home Financials are based on the most recent Mortgage that was taken out on this home.
Original Mortgage
$500,000
Interest Rate
5.77%
Mortgage Type
Purchase Money Mortgage
Purchase Details
Closed on
Aug 12, 1997
Sold by
Martin Craig A and Martin Karen A
Bought by
Goble John G and Goble Mary T
Home Financials for this Owner
Home Financials are based on the most recent Mortgage that was taken out on this home.
Original Mortgage
$232,000
Interest Rate
7.43%
Purchase Details
Closed on
Oct 25, 1989
Create a Home Valuation Report for This Property
The Home Valuation Report is an in-depth analysis detailing your home's value as well as a comparison with similar homes in the area
Home Values in the Area
Average Home Value in this Area
Purchase History
| Date | Buyer | Sale Price | Title Company |
|---|---|---|---|
| Kim Family Trust | -- | None Listed On Document | |
| Kim Michael Gene | -- | None Listed On Document | |
| Kim Michael G | $630,000 | None Available | |
| Goble Mary T | -- | Chicago Title Company | |
| Goble John G | $290,000 | Southland Title | |
| -- | $340,000 | -- |
Source: Public Records
Mortgage History
| Date | Status | Borrower | Loan Amount |
|---|---|---|---|
| Previous Owner | Goble Mary T | $500,000 | |
| Previous Owner | Goble John G | $232,000 |
Source: Public Records
Tax History
| Year | Tax Paid | Tax Assessment Tax Assessment Total Assessment is a certain percentage of the fair market value that is determined by local assessors to be the total taxable value of land and additions on the property. | Land | Improvement |
|---|---|---|---|---|
| 2025 | $8,611 | $827,280 | $324,327 | $502,953 |
| 2024 | $8,611 | $811,060 | $317,968 | $493,092 |
| 2023 | $8,566 | $795,158 | $311,734 | $483,424 |
| 2022 | $8,432 | $779,568 | $305,622 | $473,946 |
| 2021 | $8,367 | $764,283 | $299,630 | $464,653 |
| 2020 | $8,311 | $756,447 | $296,558 | $459,889 |
| 2019 | $8,159 | $741,616 | $290,744 | $450,872 |
| 2018 | $7,813 | $727,076 | $285,044 | $442,032 |
| 2017 | $92 | $681,820 | $279,455 | $402,365 |
| 2016 | $7,051 | $668,452 | $273,976 | $394,476 |
| 2015 | $7,022 | $658,412 | $269,861 | $388,551 |
| 2014 | $6,903 | $645,515 | $264,575 | $380,940 |
Source: Public Records
Map
Nearby Homes
- 2622 Half Dome Place
- 4378 Shasta Place
- 2736 Victoria Ave
- 4375 Stanford St
- 2726 Naples Ct
- 3492 Corvallis St
- 2816 Fairfield Ave
- 3467 Corvallis St
- 2823 Andover Ave
- 2835 Hillsboro Ct
- 2822 Winthrop Ave
- 2808 Winthrop Ave
- 3920 Holly Brae Ln
- 3038 Greenwich St
- 1896 E Pointe Ave
- 4669 Coralwood Cir
- 4843 Nelson Ct
- 3019 Glenbrook St
- 2959 Cape Cod Cir
- 3442 Celinda Dr
- 4362 Point Reyes Ct
- 4374 Point Reyes Ct
- 2678 Sausalito Ave
- 2672 Sausalito Ave
- 4380 Carmel Dr
- 2684 Sausalito Ave
- 2668 Sausalito Ave Unit 3
- 2690 Sausalito Ave
- 2660 Sausalito Ave
- 2692 Sausalito Ave
- 4359 Carmel Dr
- 4344 Point Reyes Ct
- 4363 Carmel Dr
- 2677 Sausalito Ave
- 4369 Carmel Dr
- 4373 Carmel Dr
- 2673 Sausalito Ave
- 2654 Sausalito Ave
- 4379 Carmel Dr
- 2683 Sausalito Ave
Your Personal Tour Guide
Ask me questions while you tour the home.