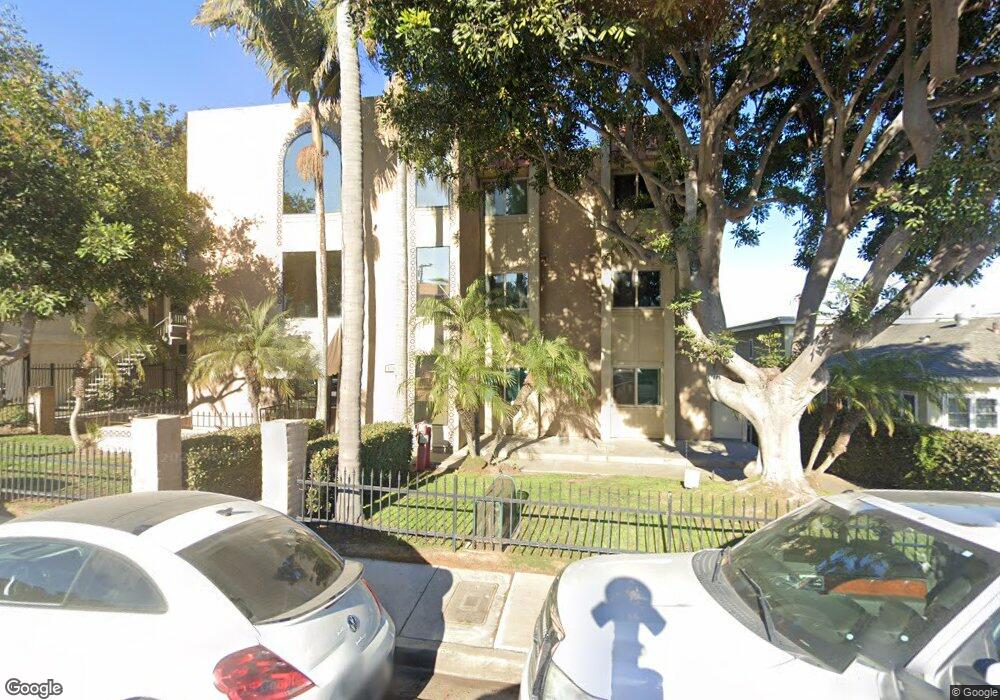
4368 Temecula St Unit 302 San Diego, CA 92107
Point Loma Heights NeighborhoodEstimated Value: $463,768 - $566,000
1
Bed
1
Bath
606
Sq Ft
$815/Sq Ft
Est. Value
About This Home
This home is located at 4368 Temecula St Unit 302, San Diego, CA 92107 and is currently estimated at $493,942, approximately $815 per square foot. 4368 Temecula St Unit 302 is a home located in San Diego County with nearby schools including Ocean Beach Elementary School, Richard Henry Dana Middle School, and Correia Middle School.
Ownership History
Date
Name
Owned For
Owner Type
Purchase Details
Closed on
Oct 17, 2012
Sold by
Trolinger Mildred S
Bought by
Trolinger Mildred S
Current Estimated Value
Home Financials for this Owner
Home Financials are based on the most recent Mortgage that was taken out on this home.
Original Mortgage
$176,700
Outstanding Balance
$122,417
Interest Rate
3.52%
Mortgage Type
New Conventional
Estimated Equity
$371,525
Purchase Details
Closed on
Aug 16, 2010
Sold by
Trolinger Mildred S
Bought by
Trolinger Mildred S
Purchase Details
Closed on
Jun 14, 2002
Sold by
Robinson William R and Robinson Lucy C
Bought by
Trolinger Mildred S
Home Financials for this Owner
Home Financials are based on the most recent Mortgage that was taken out on this home.
Original Mortgage
$204,650
Interest Rate
6.71%
Purchase Details
Closed on
Nov 3, 1986
Create a Home Valuation Report for This Property
The Home Valuation Report is an in-depth analysis detailing your home's value as well as a comparison with similar homes in the area
Home Values in the Area
Average Home Value in this Area
Purchase History
| Date | Buyer | Sale Price | Title Company |
|---|---|---|---|
| Trolinger Mildred S | -- | Accommodation | |
| Trolinger Mildred S | -- | American Coast Title Company | |
| Trolinger Mildred S | -- | None Available | |
| Trolinger Mildred S | $211,000 | Commonwealth Land Title Co | |
| -- | $60,500 | -- |
Source: Public Records
Mortgage History
| Date | Status | Borrower | Loan Amount |
|---|---|---|---|
| Open | Trolinger Mildred S | $176,700 | |
| Closed | Trolinger Mildred S | $204,650 |
Source: Public Records
Tax History Compared to Growth
Tax History
| Year | Tax Paid | Tax Assessment Tax Assessment Total Assessment is a certain percentage of the fair market value that is determined by local assessors to be the total taxable value of land and additions on the property. | Land | Improvement |
|---|---|---|---|---|
| 2025 | $3,625 | $305,573 | $202,751 | $102,822 |
| 2024 | $3,625 | $299,582 | $198,776 | $100,806 |
| 2023 | $3,543 | $293,709 | $194,879 | $98,830 |
| 2022 | $3,448 | $287,951 | $191,058 | $96,893 |
| 2021 | $3,423 | $282,306 | $187,312 | $94,994 |
| 2020 | $3,381 | $279,412 | $185,392 | $94,020 |
| 2019 | $3,319 | $273,934 | $181,757 | $92,177 |
| 2018 | $3,102 | $268,564 | $178,194 | $90,370 |
| 2017 | $2,696 | $235,000 | $162,000 | $73,000 |
| 2016 | $2,353 | $205,000 | $142,000 | $63,000 |
| 2015 | $2,295 | $200,000 | $139,000 | $61,000 |
| 2014 | $1,891 | $165,000 | $115,000 | $50,000 |
Source: Public Records
Map
Nearby Homes
- 4377 Rialto St Unit 1, 2
- 4377 Rialto St
- 4377 Rialto St Unit 449-867-01-00
- 4380 Temecula St Unit 4
- 4368 Temecula St Unit 101
- 4375 Temecula St Unit 77
- 4363 Temecula St
- 4444 W Point Loma Blvd Unit 23
- 4444 W Point Loma Blvd Unit 16
- 4444 W Point Loma Blvd Unit 122
- 4444 W Point Loma Blvd Unit 45
- 4337-39 Mentone St
- 4494 Mentone St Unit 6
- 3098 Rue Dorleans Unit 302
- 3098 Rue Dorleans Unit 331
- 4263 Mentone St Unit 65
- 3050 Rue D’orleans Unit 461
- 3017 Orleans E
- 3104 Orleans E
- 2658 Worden St Unit 223
- 4368 Temecula St
- 4368 Temecula St Unit 205
- 4368 Temecula St Unit 204
- 4368 Temecula St Unit 203
- 4368 Temecula St Unit 202
- 4368 Temecula St Unit 201
- 4368 Temecula St Unit 105
- 4368 Temecula St Unit 104
- 4368 Temecula St Unit 103
- 4368 Temecula St Unit 102
- 4368 Temecula St Unit 305
- 4368 Temecula St Unit 304
- 4368 Temecula St Unit 303
- 4368 Temecula St Unit 301
- 4362 Temecula St Unit A
- 4362 Temecula St
- 4380 Temecula Street #7
- 4380 Temecula St
- 4380 Temecula St Unit 6
- 4380 Temecula St Unit 5