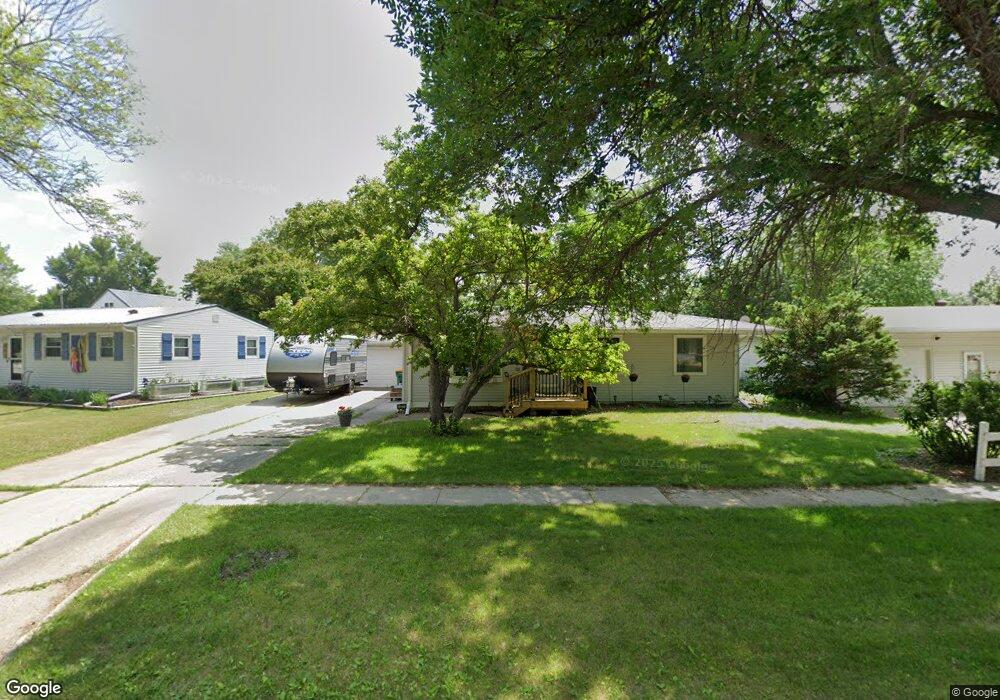
437 3rd Ave E West Fargo, ND 58078
Sukut's NeighborhoodEstimated Value: $251,000 - $289,171
3
Beds
2
Baths
960
Sq Ft
$281/Sq Ft
Est. Value
About This Home
This home is located at 437 3rd Ave E, West Fargo, ND 58078 and is currently estimated at $270,086, approximately $281 per square foot. 437 3rd Ave E is a home located in Cass County with nearby schools including L.E. Berger Elementary School, Cheney Middle School, and West Fargo High School.
Ownership History
Date
Name
Owned For
Owner Type
Purchase Details
Closed on
Nov 6, 2009
Sold by
Brossart Mark A
Bought by
Syverson Deann M
Current Estimated Value
Home Financials for this Owner
Home Financials are based on the most recent Mortgage that was taken out on this home.
Original Mortgage
$126,663
Outstanding Balance
$83,965
Interest Rate
5.3%
Mortgage Type
FHA
Estimated Equity
$186,121
Purchase Details
Closed on
Jun 16, 2006
Sold by
Schulz Darcey D and Schulz Patricia K
Bought by
Brossart Mark A
Home Financials for this Owner
Home Financials are based on the most recent Mortgage that was taken out on this home.
Original Mortgage
$119,262
Interest Rate
6.5%
Mortgage Type
FHA
Create a Home Valuation Report for This Property
The Home Valuation Report is an in-depth analysis detailing your home's value as well as a comparison with similar homes in the area
Home Values in the Area
Average Home Value in this Area
Purchase History
| Date | Buyer | Sale Price | Title Company |
|---|---|---|---|
| Syverson Deann M | -- | -- | |
| Brossart Mark A | $121,500 | -- |
Source: Public Records
Mortgage History
| Date | Status | Borrower | Loan Amount |
|---|---|---|---|
| Open | Syverson Deann M | $126,663 | |
| Previous Owner | Brossart Mark A | $119,262 |
Source: Public Records
Tax History
| Year | Tax Paid | Tax Assessment Tax Assessment Total Assessment is a certain percentage of the fair market value that is determined by local assessors to be the total taxable value of land and additions on the property. | Land | Improvement |
|---|---|---|---|---|
| 2024 | $3,228 | $118,250 | $19,450 | $98,800 |
| 2023 | $3,323 | $121,600 | $19,450 | $102,150 |
| 2022 | $3,184 | $111,000 | $19,450 | $91,550 |
| 2021 | $2,965 | $98,800 | $14,150 | $84,650 |
| 2020 | $2,551 | $85,050 | $14,150 | $70,900 |
| 2019 | $2,572 | $85,900 | $14,150 | $71,750 |
| 2018 | $2,467 | $85,950 | $14,150 | $71,800 |
| 2017 | $2,362 | $84,100 | $14,150 | $69,950 |
| 2016 | $2,089 | $81,600 | $14,150 | $67,450 |
| 2015 | $2,035 | $72,950 | $14,600 | $58,350 |
| 2014 | $1,993 | $68,200 | $14,600 | $53,600 |
| 2013 | $1,849 | $63,750 | $12,900 | $50,850 |
Source: Public Records
Map
Nearby Homes
- 431 5th Ave E Unit 1
- 217 1st Ave E
- 631 7th Ave E
- 832 5th Ave E
- 105 Evergreen Cir
- 45 Center St
- 622 12th Ave E
- 620 Sukut St
- 232 1st Ave W
- 236 1st Ave W
- 1059 Sommerset Place
- 801 9th St E
- 602 12 1 2 Ave E Unit 5
- 245 12th Ave E
- 332 13th Ave E
- 226 10 1/2 Ave W
- 1332 Sandstone Dr
- 520 6th Ave W Unit 8
- 714 14th Ave E
- 1610 Suntree Dr
Your Personal Tour Guide
Ask me questions while you tour the home.