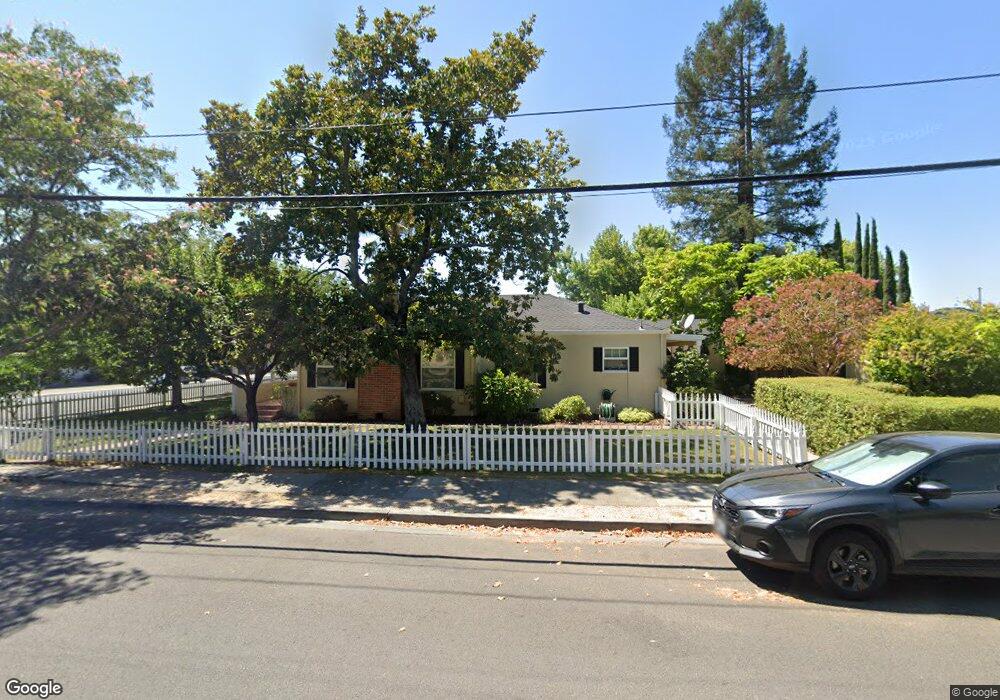
437 3rd St W Sonoma, CA 95476
Estimated Value: $1,293,000 - $1,640,567
4
Beds
3
Baths
2,792
Sq Ft
$513/Sq Ft
Est. Value
About This Home
This home is located at 437 3rd St W, Sonoma, CA 95476 and is currently estimated at $1,431,392, approximately $512 per square foot. 437 3rd St W is a home located in Sonoma County with nearby schools including Sassarini Elementary School, Altimira Middle School, and Creekside High School.
Ownership History
Date
Name
Owned For
Owner Type
Purchase Details
Closed on
Mar 6, 2020
Sold by
Worona Marc A and Worona Donna L
Bought by
Worona Marc A and Worona Donna L
Current Estimated Value
Purchase Details
Closed on
May 7, 2009
Sold by
Sposeto Wanda B
Bought by
Worona Marc A and Worona Donna L
Home Financials for this Owner
Home Financials are based on the most recent Mortgage that was taken out on this home.
Original Mortgage
$589,600
Outstanding Balance
$363,227
Interest Rate
4.71%
Mortgage Type
Commercial
Estimated Equity
$1,068,165
Purchase Details
Closed on
Nov 20, 1997
Sold by
Bruhn Leonard E & Barbara Trust and Ersula B
Bought by
Sposeto Wanda B
Home Financials for this Owner
Home Financials are based on the most recent Mortgage that was taken out on this home.
Original Mortgage
$210,400
Interest Rate
7.33%
Mortgage Type
Commercial
Create a Home Valuation Report for This Property
The Home Valuation Report is an in-depth analysis detailing your home's value as well as a comparison with similar homes in the area
Home Values in the Area
Average Home Value in this Area
Purchase History
| Date | Buyer | Sale Price | Title Company |
|---|---|---|---|
| Worona Marc A | -- | None Available | |
| Worona Marc A | $737,000 | First American Title Company | |
| Sposeto Wanda B | $267,000 | First American Title |
Source: Public Records
Mortgage History
| Date | Status | Borrower | Loan Amount |
|---|---|---|---|
| Open | Worona Marc A | $589,600 | |
| Previous Owner | Sposeto Wanda B | $210,400 |
Source: Public Records
Tax History
| Year | Tax Paid | Tax Assessment Tax Assessment Total Assessment is a certain percentage of the fair market value that is determined by local assessors to be the total taxable value of land and additions on the property. | Land | Improvement |
|---|---|---|---|---|
| 2025 | $11,984 | $949,066 | $321,933 | $627,133 |
| 2024 | $11,984 | $930,458 | $315,621 | $614,837 |
| 2023 | $11,984 | $912,215 | $309,433 | $602,782 |
| 2022 | $11,527 | $894,329 | $303,366 | $590,963 |
| 2021 | $11,664 | $876,794 | $297,418 | $579,376 |
| 2020 | $11,386 | $867,805 | $294,369 | $573,436 |
| 2019 | $11,131 | $850,791 | $288,598 | $562,193 |
| 2018 | $11,105 | $834,110 | $282,940 | $551,170 |
| 2017 | $10,824 | $817,756 | $277,393 | $540,363 |
| 2016 | $10,243 | $801,722 | $271,954 | $529,768 |
| 2015 | $9,792 | $789,680 | $267,869 | $521,811 |
| 2014 | $9,855 | $774,212 | $262,622 | $511,590 |
Source: Public Records
Map
Nearby Homes
- 377 W Spain St
- 443 Casabonne Ln
- 472 5th St W
- 15881 Highway 12
- 520 Studley St
- 301 1st St W
- 257 Perkins St
- 441 7th St W Unit 5
- 510 Mitchell Way
- 649 1st St W Unit 1
- 254 1st St E
- 605 Curtin Ln
- 797 W Spain St
- 337 Bettencourt St
- 19295 Junipero Serra Dr
- 836 W Spain St Unit 3
- 781 5th St W
- 226 1st St E
- 151 E Napa St
- 216 1st St E
Your Personal Tour Guide
Ask me questions while you tour the home.