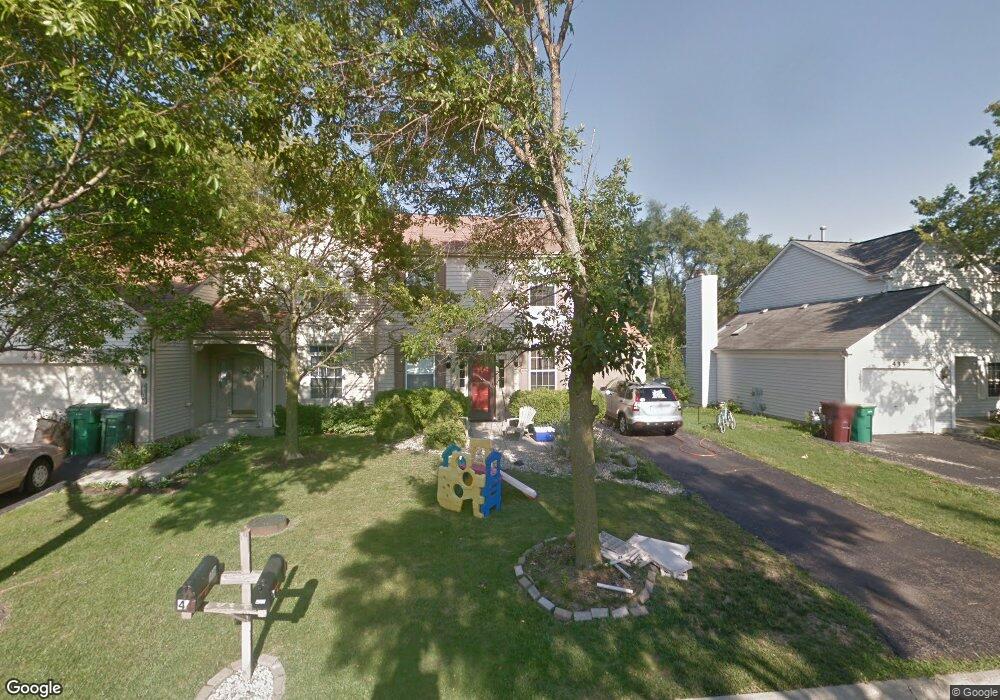
437 Attenborough Way Grayslake, IL 60030
Estimated Value: $271,000 - $308,000
3
Beds
2
Baths
1,536
Sq Ft
$188/Sq Ft
Est. Value
About This Home
This home is located at 437 Attenborough Way, Grayslake, IL 60030 and is currently estimated at $288,045, approximately $187 per square foot. 437 Attenborough Way is a home located in Lake County with nearby schools including Woodland Primary School, Woodland Elementary School, and Woodland Intermediate School.
Ownership History
Date
Name
Owned For
Owner Type
Purchase Details
Closed on
Sep 29, 2021
Sold by
Great Lakes Holdings Llc
Bought by
Florkowski Michael
Current Estimated Value
Home Financials for this Owner
Home Financials are based on the most recent Mortgage that was taken out on this home.
Original Mortgage
$168,000
Interest Rate
2.99%
Mortgage Type
New Conventional
Purchase Details
Closed on
Jul 14, 2015
Sold by
Benson Sonja R and Benson Thomas S
Bought by
Great Lakes Holdings Llc
Purchase Details
Closed on
Oct 6, 2010
Sold by
Federal National Mortgage Association
Bought by
Benson Sonja and Benson Thomas S
Home Financials for this Owner
Home Financials are based on the most recent Mortgage that was taken out on this home.
Original Mortgage
$78,750
Interest Rate
4.3%
Mortgage Type
New Conventional
Purchase Details
Closed on
Feb 9, 2010
Sold by
Braun Dennis L
Bought by
Federal National Mortgage Association
Create a Home Valuation Report for This Property
The Home Valuation Report is an in-depth analysis detailing your home's value as well as a comparison with similar homes in the area
Home Values in the Area
Average Home Value in this Area
Purchase History
| Date | Buyer | Sale Price | Title Company |
|---|---|---|---|
| Florkowski Michael | $210,000 | First American Title | |
| Great Lakes Holdings Llc | -- | None Available | |
| Benson Sonja | $105,000 | Attorneys Title Guaranty Fun | |
| Federal National Mortgage Association | -- | None Available |
Source: Public Records
Mortgage History
| Date | Status | Borrower | Loan Amount |
|---|---|---|---|
| Previous Owner | Florkowski Michael | $168,000 | |
| Previous Owner | Benson Sonja | $78,750 |
Source: Public Records
Tax History Compared to Growth
Tax History
| Year | Tax Paid | Tax Assessment Tax Assessment Total Assessment is a certain percentage of the fair market value that is determined by local assessors to be the total taxable value of land and additions on the property. | Land | Improvement |
|---|---|---|---|---|
| 2024 | $7,396 | $71,829 | $13,949 | $57,880 |
| 2023 | $7,139 | $65,922 | $12,802 | $53,120 |
| 2022 | $7,139 | $63,410 | $11,114 | $52,296 |
| 2021 | $6,458 | $55,819 | $10,683 | $45,136 |
| 2020 | $6,448 | $53,111 | $10,165 | $42,946 |
| 2019 | $7,242 | $59,318 | $9,752 | $49,566 |
| 2018 | $6,898 | $56,993 | $8,582 | $48,411 |
| 2017 | $6,846 | $53,611 | $8,073 | $45,538 |
| 2016 | $6,609 | $49,488 | $7,452 | $42,036 |
| 2015 | $6,393 | $45,211 | $6,808 | $38,403 |
| 2014 | $6,295 | $43,730 | $7,852 | $35,878 |
| 2012 | $6,208 | $45,672 | $8,201 | $37,471 |
Source: Public Records
Map
Nearby Homes
- 355 Buckingham Dr
- 707 Crossland Dr
- 399 Banbury Ln
- 23 Bobolink Dr
- 873 Essex Cir
- 820 Amelia Ct
- 745 Dillon Ct
- 633 Dove Ct Unit 4
- 1045 Manchester Cir
- 1191 Hummingbird Ln
- 618 Barron Blvd
- 20295 W Washington St
- 418 Flanders Ln
- 33276 N Sunset Ave
- 33336 N Indian Ln
- 268 Normandy Ln
- 33978 N Lake Rd
- 18740 W Willow Point Dr
- 1617 Albany St
- 1544 Syracuse Dr
- 437 Attenborough Way Unit 437
- 441 Attenborough Way
- 433 Attenborough Way
- 445 Attenborough Way
- 429 Attenborough Way
- 425 Attenborough Way
- 425 Attenborough Way Unit 425
- 449 Attenborough Way
- 438 Attenborough Way
- 434 Attenborough Way
- 444 Attenborough Way
- 421 Attenborough Way
- 453 Attenborough Way
- 464 Attenborough Way
- 417 Attenborough Way
- 470 Buckingham Dr
- 467 Buckingham Dr
- 19735 W Brae Loch Rd
- 455 Attenborough Way
- 455 Attenborough Way Unit 455