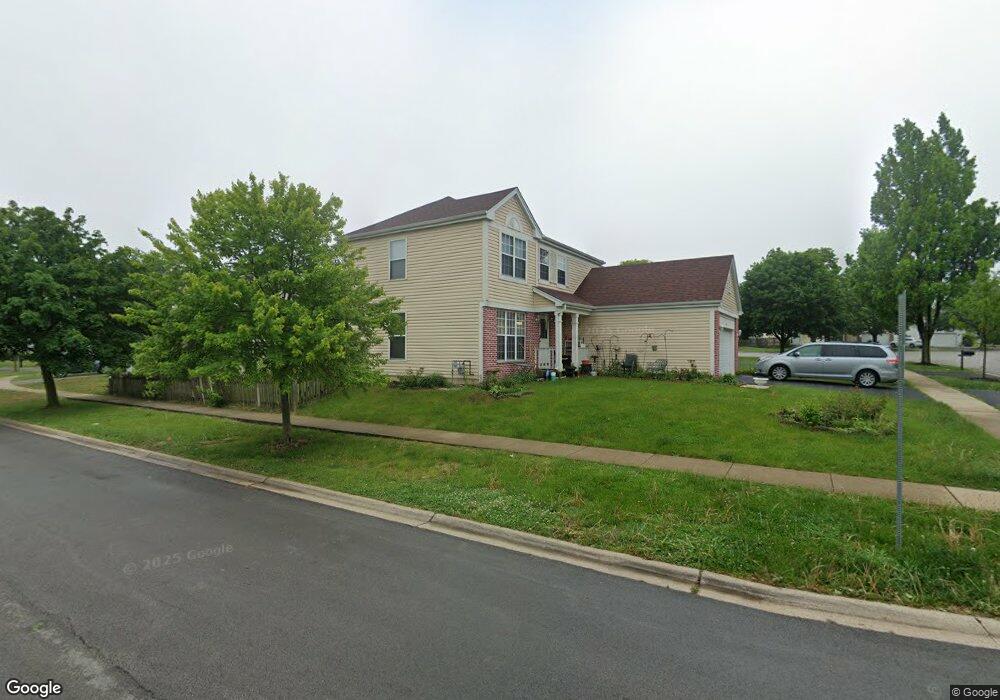
437 Bloomfield Dr Bolingbrook, IL 60440
East Bolingbrook NeighborhoodEstimated Value: $336,012 - $383,000
3
Beds
3
Baths
1,654
Sq Ft
$219/Sq Ft
Est. Value
About This Home
This home is located at 437 Bloomfield Dr, Bolingbrook, IL 60440 and is currently estimated at $361,753, approximately $218 per square foot. 437 Bloomfield Dr is a home located in Will County with nearby schools including Independence Elementary School, Jane Addams Middle School, and Bolingbrook High School.
Ownership History
Date
Name
Owned For
Owner Type
Purchase Details
Closed on
May 17, 2006
Sold by
Qureshi Akheel and Khan Najees
Bought by
Qureshi Akheel and Bakshi Nafis
Current Estimated Value
Purchase Details
Closed on
Jun 28, 2001
Sold by
Smith William R and Smith Rebecca L
Bought by
Qureshi Akheel R and Khan Najees
Home Financials for this Owner
Home Financials are based on the most recent Mortgage that was taken out on this home.
Original Mortgage
$181,126
Outstanding Balance
$70,106
Interest Rate
7.2%
Mortgage Type
FHA
Estimated Equity
$291,647
Purchase Details
Closed on
Sep 15, 1994
Sold by
Oak Brook Bank
Bought by
Smith William R and Smith Rebecca L
Home Financials for this Owner
Home Financials are based on the most recent Mortgage that was taken out on this home.
Original Mortgage
$113,100
Interest Rate
7.12%
Create a Home Valuation Report for This Property
The Home Valuation Report is an in-depth analysis detailing your home's value as well as a comparison with similar homes in the area
Home Values in the Area
Average Home Value in this Area
Purchase History
| Date | Buyer | Sale Price | Title Company |
|---|---|---|---|
| Qureshi Akheel | -- | None Available | |
| Qureshi Akheel R | $184,000 | First American Title | |
| Smith William R | $143,000 | -- |
Source: Public Records
Mortgage History
| Date | Status | Borrower | Loan Amount |
|---|---|---|---|
| Open | Qureshi Akheel R | $181,126 | |
| Previous Owner | Smith William R | $113,100 |
Source: Public Records
Tax History
| Year | Tax Paid | Tax Assessment Tax Assessment Total Assessment is a certain percentage of the fair market value that is determined by local assessors to be the total taxable value of land and additions on the property. | Land | Improvement |
|---|---|---|---|---|
| 2024 | $5,605 | $101,109 | $19,725 | $81,384 |
| 2023 | $5,605 | $90,975 | $17,748 | $73,227 |
| 2022 | $6,493 | $82,019 | $16,001 | $66,018 |
| 2021 | $7,117 | $76,689 | $14,961 | $61,728 |
| 2020 | $6,895 | $74,167 | $14,469 | $59,698 |
| 2019 | $6,669 | $70,635 | $13,780 | $56,855 |
| 2018 | $6,399 | $67,606 | $13,189 | $54,417 |
| 2017 | $6,087 | $64,081 | $12,501 | $51,580 |
| 2016 | $5,906 | $61,000 | $11,900 | $49,100 |
| 2015 | $5,638 | $58,500 | $11,400 | $47,100 |
| 2014 | $5,638 | $56,800 | $11,100 | $45,700 |
| 2013 | $5,638 | $63,100 | $12,300 | $50,800 |
Source: Public Records
Map
Nearby Homes
- 450 Lily Cache Ln
- 528 Alcott Ln
- 309 Emerald Ct Unit 15/4
- 548 Larkspur Dr
- 372 Windsong Ct Unit 4110
- 209 Mill Stream Dr
- 209 Bunker Hill Dr
- 10 Fernwood Dr Unit L
- 80 Fernwood Dr Unit O
- 5 E Fernwood Dr
- 164 Galewood Dr
- 160 Galewood Dr
- 401 Foxborough Trail
- 118 Springleaf Dr Unit 5
- 217 S Orchard Dr
- 426 Greentree Ln Unit 6
- 226 Grant Dr
- 127 Monticello Cir
- 4 Franklin Ct Unit 2
- 408 Colony Ct Unit 4
- 441 Bloomfield Dr Unit 1
- 429 Columbine Ln Unit 1
- 452 Columbine Ln
- 445 Bloomfield Dr
- 438 Bloomfield Dr
- 425 Columbine Ln Unit 1
- 442 Bloomfield Dr
- 456 Columbine Ln
- 450 Bloomfield Dr
- 421 Columbine Ln Unit 1
- 449 Bloomfield Dr Unit 1
- 460 Columbine Ln
- 453 Bloomfield Dr
- 432 Columbine Ln
- 471 Columbine Ln Unit 1
- 417 Columbine Ln Unit 1
- 458 Bloomfield Dr Unit 1
- 464 Columbine Ln Unit 1
- 457 Bloomfield Dr Unit 1
- 428 Columbine Ln
Your Personal Tour Guide
Ask me questions while you tour the home.