Estimated Value: $473,037 - $647,000
2
Beds
3
Baths
1,613
Sq Ft
$354/Sq Ft
Est. Value
About This Home
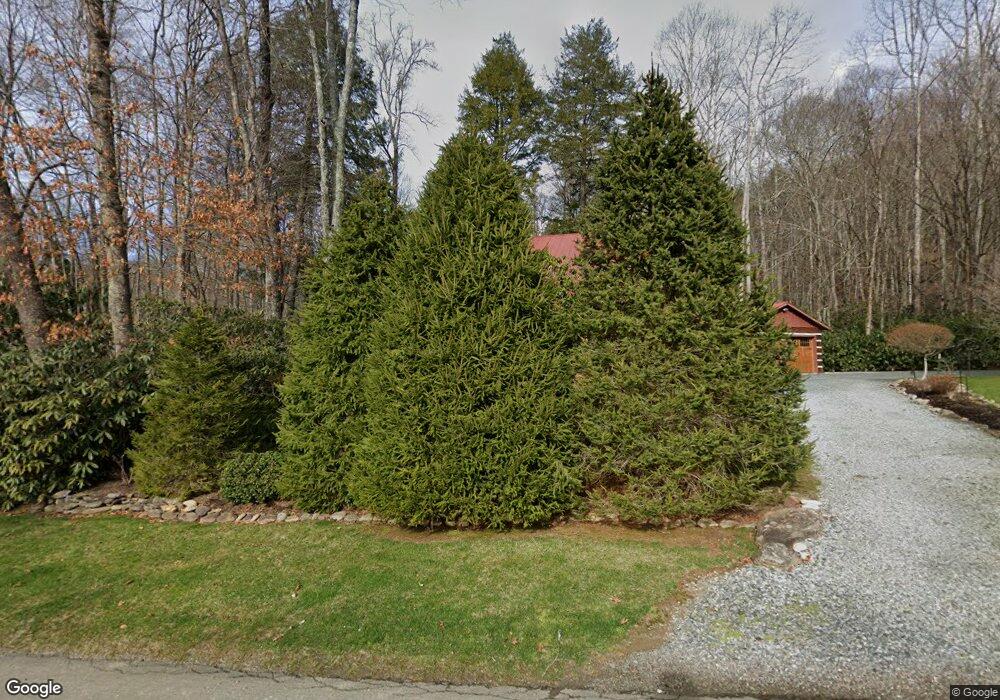
This home is located at 437 Calloway Rd, Boone, NC 28607 and is currently estimated at $571,259, approximately $354 per square foot. 437 Calloway Rd is a home located in Watauga County with nearby schools including Valle Crucis Elementary School and Watauga High School.
Ownership History
Date
Name
Owned For
Owner Type
Purchase Details
Closed on
Jun 23, 2011
Sold by
Shell Investments Llc
Bought by
Clagg Michael W and Clagg Betty O
Current Estimated Value
Home Financials for this Owner
Home Financials are based on the most recent Mortgage that was taken out on this home.
Original Mortgage
$273,999
Outstanding Balance
$187,436
Interest Rate
4.62%
Mortgage Type
New Conventional
Estimated Equity
$383,823
Purchase Details
Closed on
Mar 11, 2008
Sold by
Shell Linvestments Llc
Bought by
Lovette Anthony G and Lovette Shelley
Purchase Details
Closed on
May 19, 2006
Sold by
Schaffer Richard B
Bought by
Shell Investments Llc
Purchase Details
Closed on
May 16, 2006
Sold by
Schaffer Richard B
Bought by
Shell Investments Llc
Purchase Details
Closed on
Jan 7, 2005
Sold by
Schaffer Richard B
Bought by
Schaffer Richard B
Create a Home Valuation Report for This Property
The Home Valuation Report is an in-depth analysis detailing your home's value as well as a comparison with similar homes in the area
Home Values in the Area
Average Home Value in this Area
Purchase History
| Date | Buyer | Sale Price | Title Company |
|---|---|---|---|
| Clagg Michael W | $297,500 | None Available | |
| Lovette Anthony G | -- | None Available | |
| Shell Investments Llc | -- | None Available | |
| Shell Investments Llc | $290,000 | None Available | |
| Schaffer Richard B | -- | None Available |
Source: Public Records
Mortgage History
| Date | Status | Borrower | Loan Amount |
|---|---|---|---|
| Open | Clagg Michael W | $273,999 |
Source: Public Records
Tax History
| Year | Tax Paid | Tax Assessment Tax Assessment Total Assessment is a certain percentage of the fair market value that is determined by local assessors to be the total taxable value of land and additions on the property. | Land | Improvement |
|---|---|---|---|---|
| 2025 | $1,001 | $244,100 | $26,300 | $217,800 |
| 2024 | $1,001 | $244,100 | $26,300 | $217,800 |
| 2023 | $978 | $244,100 | $26,300 | $217,800 |
| 2022 | $978 | $244,100 | $26,300 | $217,800 |
| 2021 | $1,135 | $233,000 | $25,000 | $208,000 |
| 2020 | $1,135 | $233,000 | $25,000 | $208,000 |
| 2019 | $1,135 | $233,000 | $25,000 | $208,000 |
| 2018 | $1,019 | $233,000 | $25,000 | $208,000 |
| 2017 | $1,019 | $233,000 | $25,000 | $208,000 |
| 2013 | -- | $225,900 | $25,000 | $200,900 |
Source: Public Records
Map
Nearby Homes
- Lot 6B Twin Rivers Dr
- 446 Peaceful Haven Dr Unit 832
- 446 Peaceful Haven Dr Unit 811
- Lot 219 Ontario
- 509 Twin Rivers Dr
- 506 Peaceful Haven Dr Unit 1111
- 201 Twin Rivers Dr
- 145 Rising Fawn Pass Unit 17-B
- 9 Jackson Ridge Rd
- 20 Twin Rivers Dr
- 3 Jackson Ridge Rd
- 19 Jackson Ridge Rd
- TBD Vista Ln
- 1 Jackson Ridge Rd
- 10 Jackson Ridge Rd
- 13 Jackson Ridge Rd
- 4 Seneca Dr
- 14 Jackson Ridge Rd
- 656 Winterberry Trail
- 637 Ontario Ridge
- 438 Calloway Rd
- 417 Calloway Rd
- 440 Calloway Rd
- TBD Calloway Rd
- 513 Calloway Rd
- 372 Calloway Rd
- 512 Calloway Rd
- 145 River Way
- 565 Calloway Rd
- 119 River Way
- 157 River Way
- 405 Calloway Rd
- 120 River Way
- 540 Calloway Rd
- 146 River Way
- 621 Calloway Rd
- 160 River Way
- 324 Calloway Rd
- TBD Paris Rd
- 633 Calloway Rd
Your Personal Tour Guide
Ask me questions while you tour the home.