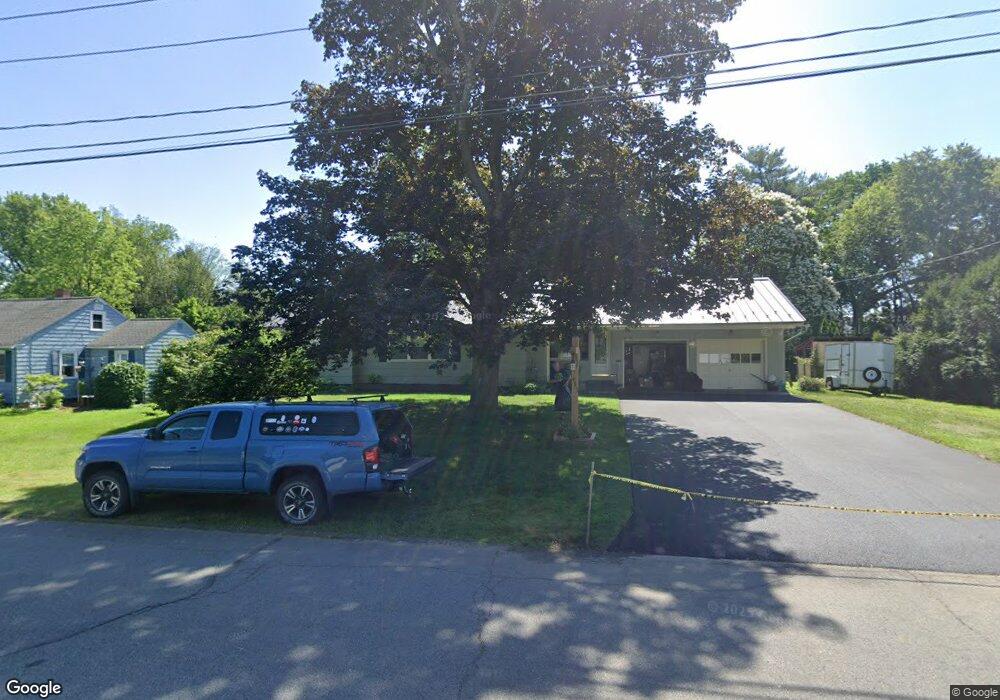
437 Davis St Greenfield, MA 01301
Estimated Value: $303,000 - $349,000
3
Beds
1
Bath
1,454
Sq Ft
$227/Sq Ft
Est. Value
About This Home
This home is located at 437 Davis St, Greenfield, MA 01301 and is currently estimated at $330,687, approximately $227 per square foot. 437 Davis St is a home located in Franklin County with nearby schools including Cornerstone Christian School, Holy Trinity School, and Stoneleigh-Burnham School.
Ownership History
Date
Name
Owned For
Owner Type
Purchase Details
Closed on
Mar 15, 2022
Sold by
Turner James A
Bought by
Walk Stephen E and Walk Terry L
Current Estimated Value
Home Financials for this Owner
Home Financials are based on the most recent Mortgage that was taken out on this home.
Original Mortgage
$213,750
Outstanding Balance
$199,711
Interest Rate
3.92%
Mortgage Type
Purchase Money Mortgage
Estimated Equity
$130,976
Create a Home Valuation Report for This Property
The Home Valuation Report is an in-depth analysis detailing your home's value as well as a comparison with similar homes in the area
Home Values in the Area
Average Home Value in this Area
Purchase History
| Date | Buyer | Sale Price | Title Company |
|---|---|---|---|
| Walk Stephen E | $225,000 | None Available | |
| Walk Stephen E | $225,000 | None Available |
Source: Public Records
Mortgage History
| Date | Status | Borrower | Loan Amount |
|---|---|---|---|
| Open | Walk Stephen E | $213,750 | |
| Closed | Walk Stephen E | $213,750 |
Source: Public Records
Tax History Compared to Growth
Tax History
| Year | Tax Paid | Tax Assessment Tax Assessment Total Assessment is a certain percentage of the fair market value that is determined by local assessors to be the total taxable value of land and additions on the property. | Land | Improvement |
|---|---|---|---|---|
| 2025 | $4,972 | $254,200 | $75,900 | $178,300 |
| 2024 | $4,896 | $240,100 | $62,500 | $177,600 |
| 2023 | $4,431 | $225,500 | $62,500 | $163,000 |
| 2022 | $4,319 | $193,500 | $59,500 | $134,000 |
| 2021 | $4,221 | $181,800 | $59,500 | $122,300 |
| 2020 | $3,914 | $170,700 | $59,500 | $111,200 |
| 2019 | $3,642 | $162,900 | $51,700 | $111,200 |
| 2018 | $3,578 | $159,500 | $50,600 | $108,900 |
| 2017 | $3,466 | $159,500 | $50,600 | $108,900 |
| 2016 | $3,468 | $159,000 | $53,600 | $105,400 |
| 2015 | $3,485 | $154,800 | $53,600 | $101,200 |
| 2014 | $3,176 | $154,700 | $53,600 | $101,100 |
Source: Public Records
Map
Nearby Homes