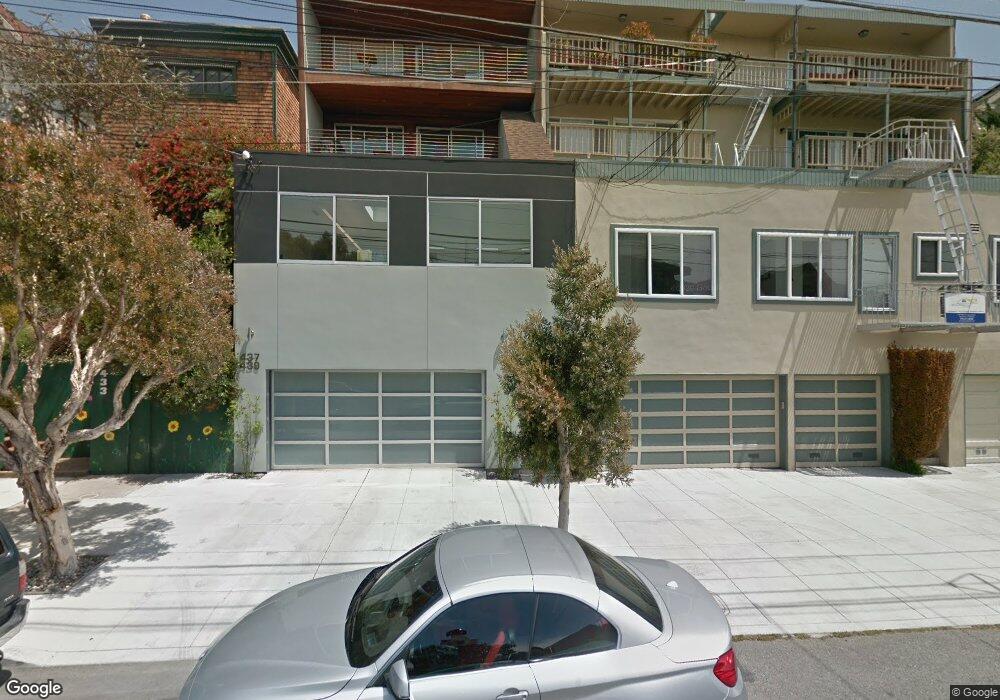
437 Diamond St San Francisco, CA 94114
Eureka Valley-Dolores Heights NeighborhoodEstimated Value: $2,368,000 - $3,845,000
3
Beds
4
Baths
3,430
Sq Ft
$874/Sq Ft
Est. Value
About This Home
This home is located at 437 Diamond St, San Francisco, CA 94114 and is currently estimated at $2,997,417, approximately $873 per square foot. 437 Diamond St is a home located in San Francisco County with nearby schools including Harvey Milk Civil Rights Academy, Everett Middle School, and Thomas Edison Charter Academy.
Ownership History
Date
Name
Owned For
Owner Type
Purchase Details
Closed on
Feb 12, 2024
Sold by
Kozacko Pham Trust
Bought by
David G Kopf Living Trust and Archer
Current Estimated Value
Purchase Details
Closed on
Sep 26, 2022
Sold by
Kozacko Derek W
Bought by
Kozacko Pham Trust
Purchase Details
Closed on
Mar 17, 2015
Sold by
Kozacko Derek W and Pham Hanh R
Bought by
Kozacko Derek W and Pham Hanh T
Home Financials for this Owner
Home Financials are based on the most recent Mortgage that was taken out on this home.
Original Mortgage
$625,500
Interest Rate
3.97%
Mortgage Type
Commercial
Purchase Details
Closed on
Jul 23, 2010
Sold by
Sarrett Edward H
Bought by
Kozacko Derek W and Pham Hanh T
Home Financials for this Owner
Home Financials are based on the most recent Mortgage that was taken out on this home.
Original Mortgage
$727,500
Interest Rate
4.51%
Mortgage Type
Commercial
Purchase Details
Closed on
Aug 29, 2003
Sold by
Montoya Frank S
Bought by
Montoya Frank S
Create a Home Valuation Report for This Property
The Home Valuation Report is an in-depth analysis detailing your home's value as well as a comparison with similar homes in the area
Home Values in the Area
Average Home Value in this Area
Purchase History
| Date | Buyer | Sale Price | Title Company |
|---|---|---|---|
| David G Kopf Living Trust | $3,700,000 | First American Title | |
| Kozacko Pham Trust | -- | -- | |
| Kozacko Derek W | -- | Chicago Title Company | |
| Kozacko Derek W | $970,000 | Fidelity National Title Co | |
| Montoya Frank S | -- | -- |
Source: Public Records
Mortgage History
| Date | Status | Borrower | Loan Amount |
|---|---|---|---|
| Previous Owner | Kozacko Derek W | $625,500 | |
| Previous Owner | Kozacko Derek W | $727,500 |
Source: Public Records
Tax History Compared to Growth
Tax History
| Year | Tax Paid | Tax Assessment Tax Assessment Total Assessment is a certain percentage of the fair market value that is determined by local assessors to be the total taxable value of land and additions on the property. | Land | Improvement |
|---|---|---|---|---|
| 2025 | $18,016 | $1,507,133 | $869,914 | $637,219 |
| 2024 | $18,016 | $1,477,582 | $852,857 | $624,725 |
| 2023 | $17,744 | $1,448,612 | $836,135 | $612,477 |
| 2022 | $16,661 | $1,420,198 | $819,736 | $600,462 |
| 2021 | $16,350 | $1,392,354 | $803,664 | $588,690 |
| 2020 | $16,467 | $1,378,080 | $795,424 | $582,656 |
| 2019 | $15,888 | $1,351,060 | $779,828 | $571,232 |
| 2018 | $15,334 | $1,324,572 | $764,538 | $560,034 |
| 2017 | $15,595 | $1,298,602 | $749,548 | $549,054 |
| 2016 | $12,771 | $1,049,788 | $734,852 | $314,936 |
| 2015 | $12,611 | $1,034,020 | $723,814 | $310,206 |
| 2014 | $12,279 | $1,013,766 | $709,636 | $304,130 |
Source: Public Records
Map
Nearby Homes
- 417-419 Eureka St
- 4229 21st St
- 4031 22nd St
- 584 Douglass St
- 308 Diamond St
- 335 Diamond St
- 1 Hoffman Ave Unit A
- 734 Elizabeth St
- 3711 Market St Unit 2
- 317 Douglass St Unit 317
- 49 Seward St Unit 1
- 767 Corbett Ave Unit 3
- 729 Douglass St
- 729 Douglass St Unit A
- 755 Corbett Ave
- 4454 23rd St Unit 2
- 655 Corbett Ave Unit 505
- 672 Corbett Ave Unit C
- 4106 20th St
- 930 Elizabeth St Unit 1
- 445 Diamond St
- 439 Diamond St Unit 441
- 433 Diamond St
- 425 Diamond St
- 455 Diamond St
- 423 Diamond St
- 421 Diamond St
- 457 Diamond St
- 415 Diamond St
- 465 Diamond St
- 436 Diamond St
- 446 Diamond St
- 432 Diamond St
- 411 Diamond St
- 448 Diamond St
- 426 Diamond St
- 469 Diamond St
- 456 Diamond St
- 420 Diamond St
- 462 Diamond St