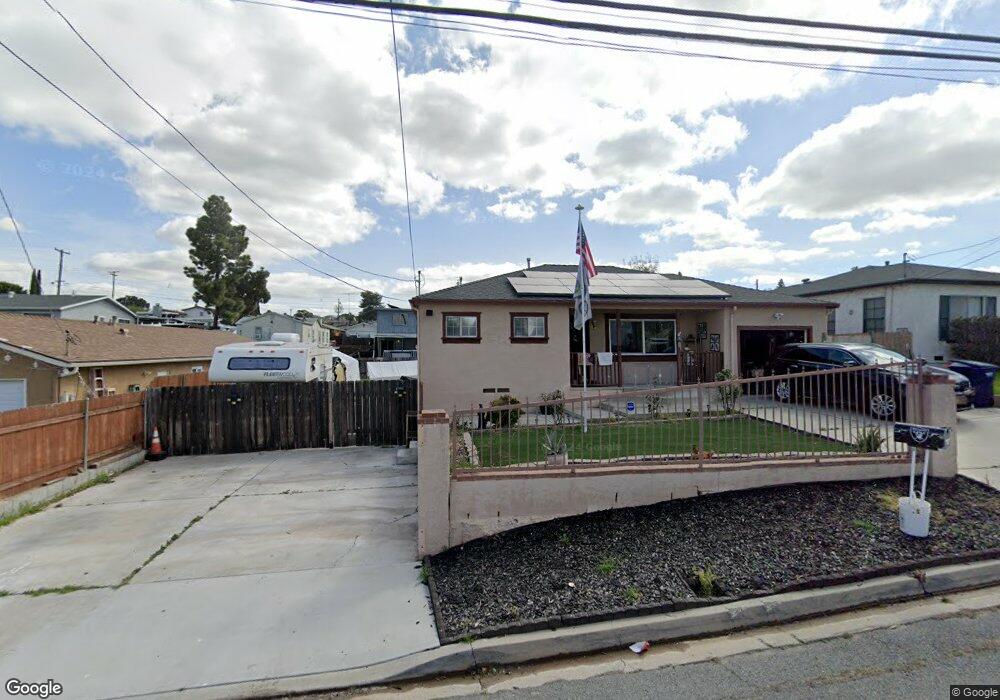
437 Kempton St Spring Valley, CA 91977
Estimated Value: $723,000 - $904,000
4
Beds
2
Baths
1,397
Sq Ft
$565/Sq Ft
Est. Value
About This Home
This home is located at 437 Kempton St, Spring Valley, CA 91977 and is currently estimated at $789,792, approximately $565 per square foot. 437 Kempton St is a home located in San Diego County with nearby schools including La Presa Elementary School, Science, Technology, Engineering, Arts, And Math Academy, and Mount Miguel High School.
Ownership History
Date
Name
Owned For
Owner Type
Purchase Details
Closed on
Sep 4, 2019
Sold by
Silvestre Cesar
Bought by
Miller Frank and Miller Frances
Current Estimated Value
Home Financials for this Owner
Home Financials are based on the most recent Mortgage that was taken out on this home.
Original Mortgage
$460,000
Outstanding Balance
$402,924
Interest Rate
3.6%
Mortgage Type
VA
Estimated Equity
$386,868
Purchase Details
Closed on
Nov 28, 2016
Sold by
Smiler Joseph B and Smiler Jean M
Bought by
Silvestre Cesar
Home Financials for this Owner
Home Financials are based on the most recent Mortgage that was taken out on this home.
Original Mortgage
$387,845
Interest Rate
3.62%
Mortgage Type
FHA
Purchase Details
Closed on
Jun 27, 2011
Sold by
Renova Investment Corp
Bought by
Smiler Joseph B and Johnson Jean M
Home Financials for this Owner
Home Financials are based on the most recent Mortgage that was taken out on this home.
Original Mortgage
$243,662
Interest Rate
4.37%
Mortgage Type
FHA
Purchase Details
Closed on
Feb 22, 2011
Sold by
Wells Fargo Bank Na
Bought by
Renova Investment Corp
Purchase Details
Closed on
Dec 6, 2010
Sold by
Hadsell Richard A and Hadsell Nancy H
Bought by
Wells Fargo Bank Na
Purchase Details
Closed on
Jul 22, 2003
Sold by
Nuhaily Muhiddene A
Bought by
Hadsell Richard A and Hadsell Nancy H
Home Financials for this Owner
Home Financials are based on the most recent Mortgage that was taken out on this home.
Original Mortgage
$252,000
Interest Rate
5.16%
Mortgage Type
Negative Amortization
Purchase Details
Closed on
Jul 1, 2003
Sold by
Nuhaily Selma
Bought by
Nuhaily Muhiddene A
Home Financials for this Owner
Home Financials are based on the most recent Mortgage that was taken out on this home.
Original Mortgage
$252,000
Interest Rate
5.16%
Mortgage Type
Negative Amortization
Purchase Details
Closed on
May 6, 2003
Sold by
Nuhaily Omar L
Bought by
Nuhaily Muhiddene A
Home Financials for this Owner
Home Financials are based on the most recent Mortgage that was taken out on this home.
Original Mortgage
$235,000
Interest Rate
6.06%
Mortgage Type
Purchase Money Mortgage
Purchase Details
Closed on
Feb 28, 1998
Sold by
Dene Nuhaily
Bought by
Huhaily Ida Lee
Purchase Details
Closed on
Aug 31, 1987
Purchase Details
Closed on
Jun 19, 1985
Purchase Details
Closed on
Feb 28, 1983
Create a Home Valuation Report for This Property
The Home Valuation Report is an in-depth analysis detailing your home's value as well as a comparison with similar homes in the area
Home Values in the Area
Average Home Value in this Area
Purchase History
| Date | Buyer | Sale Price | Title Company |
|---|---|---|---|
| Miller Frank | $460,000 | Lawyers Title Company | |
| Silvestre Cesar | $397,000 | Title 365 | |
| Silvestre Cesar | -- | Title 365 | |
| Smiler Joseph B | $250,000 | Chicago Title Company | |
| Renova Investment Corp | $161,500 | California Title Company | |
| Wells Fargo Bank Na | $173,060 | Accommodation | |
| Hadsell Richard A | $315,000 | Gateway Title | |
| Nuhaily Muhiddene A | -- | Gateway Title Company | |
| Nuhaily Muhiddene A | -- | Gateway Title Company | |
| Huhaily Ida Lee | -- | -- | |
| -- | $92,000 | -- | |
| -- | $73,300 | -- | |
| -- | $66,300 | -- |
Source: Public Records
Mortgage History
| Date | Status | Borrower | Loan Amount |
|---|---|---|---|
| Open | Miller Frank | $460,000 | |
| Previous Owner | Silvestre Cesar | $387,845 | |
| Previous Owner | Smiler Joseph B | $243,662 | |
| Previous Owner | Hadsell Richard A | $252,000 | |
| Previous Owner | Nuhaily Muhiddene A | $235,000 | |
| Previous Owner | Nuhaily Muhiddene A | $235,000 |
Source: Public Records
Tax History
| Year | Tax Paid | Tax Assessment Tax Assessment Total Assessment is a certain percentage of the fair market value that is determined by local assessors to be the total taxable value of land and additions on the property. | Land | Improvement |
|---|---|---|---|---|
| 2025 | $6,361 | $503,072 | $240,600 | $262,472 |
| 2024 | $6,361 | $493,209 | $235,883 | $257,326 |
| 2023 | $6,164 | $483,539 | $231,258 | $252,281 |
| 2022 | $6,068 | $474,059 | $226,724 | $247,335 |
| 2021 | $6,005 | $464,765 | $222,279 | $242,486 |
| 2020 | $5,771 | $460,000 | $220,000 | $240,000 |
| 2019 | $5,327 | $413,038 | $187,272 | $225,766 |
| 2018 | $5,177 | $404,940 | $183,600 | $221,340 |
| 2017 | $5,065 | $397,000 | $180,000 | $217,000 |
| 2016 | $3,381 | $265,258 | $116,713 | $148,545 |
| 2015 | $3,352 | $261,274 | $114,960 | $146,314 |
| 2014 | $3,292 | $256,157 | $112,709 | $143,448 |
Source: Public Records
Map
Nearby Homes
- 9125 Akard St
- 426 Sacramento Ave
- 661 Concepcion Ave
- 341 Paraiso Ave
- 9421 Avenida Acero
- 628 Paraiso Ave
- 534 Ramona Ave
- 734 Grand Ave
- 363 Maria Ave
- 948 Gillespie Dr
- 166 Lakeview Ave
- 817 Sacramento Ave
- 757 Grand Ave
- 8766 Kelso St
- 1034 Leland St Unit 14
- 557 Parkbrook St
- 0 Grand Ave Unit PW25084786
- 8840 Leigh Ave Unit 12
- 903 Concepcion Ave
- 524 Parkbrook St
- 429 Kempton St
- 447 Kempton St
- 442 Felicita Ave
- 436 Felicita Ave
- 444 Felicita Ave
- 432 Felicita Ave
- 451 Kempton St
- 425 Kempton St
- 9137 Outinda St
- 428 Felicita Ave
- 454 Felicita Ave
- 442 Kempton St
- 424 Felicita Ave
- 9133 Outinda St
- 421 Kempton St
- 9209 San Diego St
- 420 Felicita Ave
- 460 Kempton St
- 9215 San Diego St
- 9129 Outinda St
Your Personal Tour Guide
Ask me questions while you tour the home.