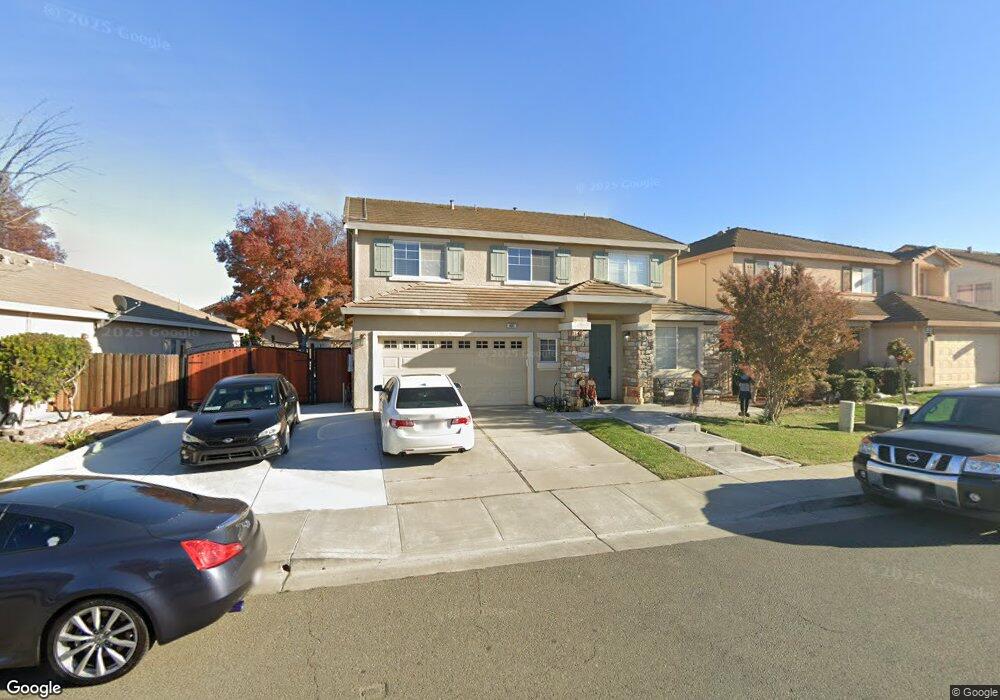
437 Maloney Ct Suisun City, CA 94585
Estimated Value: $671,488 - $735,000
3
Beds
3
Baths
2,779
Sq Ft
$252/Sq Ft
Est. Value
About This Home
This home is located at 437 Maloney Ct, Suisun City, CA 94585 and is currently estimated at $699,622, approximately $251 per square foot. 437 Maloney Ct is a home located in Solano County with nearby schools including Crescent Elementary School, Crystal Middle School, and Armijo High School.
Ownership History
Date
Name
Owned For
Owner Type
Purchase Details
Closed on
Mar 20, 2013
Sold by
Carter Steven and Carter Cassandra
Bought by
Green Michele Marie and Green Robert Abuan
Current Estimated Value
Home Financials for this Owner
Home Financials are based on the most recent Mortgage that was taken out on this home.
Original Mortgage
$314,204
Outstanding Balance
$221,323
Interest Rate
3.5%
Mortgage Type
FHA
Estimated Equity
$478,299
Purchase Details
Closed on
Jul 10, 2002
Sold by
Hofmann Construction Co
Bought by
Carter Steven and Carter Cassandra
Home Financials for this Owner
Home Financials are based on the most recent Mortgage that was taken out on this home.
Original Mortgage
$281,400
Interest Rate
6.7%
Purchase Details
Closed on
May 7, 2001
Sold by
Hofmann Land Development Company
Bought by
Hofmann Construction Co
Create a Home Valuation Report for This Property
The Home Valuation Report is an in-depth analysis detailing your home's value as well as a comparison with similar homes in the area
Home Values in the Area
Average Home Value in this Area
Purchase History
| Date | Buyer | Sale Price | Title Company |
|---|---|---|---|
| Green Michele Marie | $322,500 | Old Republic Title Company | |
| Carter Steven | $352,000 | North American Title Co | |
| Hofmann Construction Co | -- | North American Title Co |
Source: Public Records
Mortgage History
| Date | Status | Borrower | Loan Amount |
|---|---|---|---|
| Open | Green Michele Marie | $314,204 | |
| Previous Owner | Carter Steven | $281,400 |
Source: Public Records
Tax History Compared to Growth
Tax History
| Year | Tax Paid | Tax Assessment Tax Assessment Total Assessment is a certain percentage of the fair market value that is determined by local assessors to be the total taxable value of land and additions on the property. | Land | Improvement |
|---|---|---|---|---|
| 2025 | $4,901 | $397,124 | $86,194 | $310,930 |
| 2024 | $4,901 | $389,338 | $84,504 | $304,834 |
| 2023 | $4,758 | $381,705 | $82,848 | $298,857 |
| 2022 | $4,783 | $374,222 | $81,224 | $292,998 |
| 2021 | $4,698 | $366,885 | $79,632 | $287,253 |
| 2020 | $4,952 | $363,124 | $78,816 | $284,308 |
| 2019 | $4,837 | $356,005 | $77,271 | $278,734 |
| 2018 | $5,000 | $349,025 | $75,756 | $273,269 |
| 2017 | $5,051 | $342,182 | $74,271 | $267,911 |
| 2016 | $5,019 | $335,473 | $72,815 | $262,658 |
| 2015 | $4,746 | $330,435 | $71,722 | $258,713 |
| 2014 | $4,714 | $323,964 | $70,318 | $253,646 |
Source: Public Records
Map
Nearby Homes
- 1309 Hall Ln
- 345 Mayfield Cir
- 1397 Potrero Cir
- 610 Placer Ln
- 330 Engell Ct
- 301 Childs Ct
- 1280 Mayfield Cir
- 1413 Spence Ct
- 603 Woodlark Dr
- 607 Crested Dr
- 1505 Casa Loma Way
- 1109 Canary Dr
- 1416 Prospect Way
- 1201 Deanza Ct
- 1504 El Morro Ln
- 616 Emperor Dr
- 906 Trumpeter Ct
- 808 Pochard Way
- 508 Trumpeter Dr
- 752 Chula Vista Way
- 433 Maloney Ct
- 441 Maloney Ct
- 446 Meehan Ct
- 429 Maloney Ct
- 450 Meehan Ct
- 442 Meehan Ct
- 442 Maloney Ct
- 438 Maloney Ct
- 446 Maloney Ct
- 438 Meehan Ct
- 425 Maloney Ct
- 434 Maloney Ct
- 1149 Potrero Cir
- 1153 Potrero Cir
- 430 Maloney Ct
- 1145 Potrero Cir
- 434 Meehan Ct
- 1157 Potrero Cir
- 421 Maloney Ct
- 1141 Potrero Cir