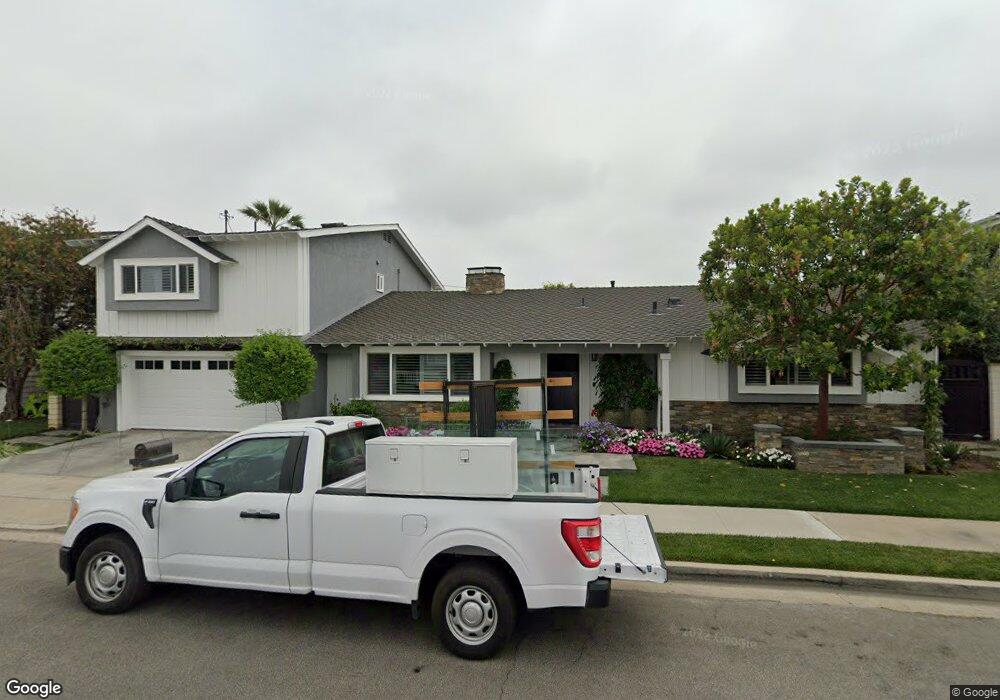
437 Ogle Cir Costa Mesa, CA 92627
Downtown Costa Mesa NeighborhoodEstimated Value: $2,023,000 - $3,352,000
4
Beds
3
Baths
2,503
Sq Ft
$1,055/Sq Ft
Est. Value
About This Home
This home is located at 437 Ogle Cir, Costa Mesa, CA 92627 and is currently estimated at $2,639,529, approximately $1,054 per square foot. 437 Ogle Cir is a home located in Orange County with nearby schools including Newport Heights Elementary, Horace Ensign Intermediate School, and Newport Harbor High School.
Ownership History
Date
Name
Owned For
Owner Type
Purchase Details
Closed on
Nov 9, 2017
Sold by
Fridlund Keith and Lovelace Tobye
Bought by
Fridlund Keith A and Lovelace Tobye S
Current Estimated Value
Purchase Details
Closed on
Aug 19, 1998
Sold by
Leonard Pieri and Leonard Phyllis F
Bought by
Fridlund Keith and Lovelace Tobye
Home Financials for this Owner
Home Financials are based on the most recent Mortgage that was taken out on this home.
Original Mortgage
$376,000
Outstanding Balance
$68,178
Interest Rate
6.92%
Estimated Equity
$2,571,351
Purchase Details
Closed on
Jun 30, 1995
Sold by
Rowan Edward B and Rowan Elaine M
Bought by
Pieri Leonard A and Sparks Phyllis F
Home Financials for this Owner
Home Financials are based on the most recent Mortgage that was taken out on this home.
Original Mortgage
$203,000
Interest Rate
7.63%
Create a Home Valuation Report for This Property
The Home Valuation Report is an in-depth analysis detailing your home's value as well as a comparison with similar homes in the area
Home Values in the Area
Average Home Value in this Area
Purchase History
| Date | Buyer | Sale Price | Title Company |
|---|---|---|---|
| Fridlund Keith A | -- | None Available | |
| Fridlund Keith | $470,000 | Stewart Title | |
| Pieri Leonard A | $335,000 | Investors Title Company |
Source: Public Records
Mortgage History
| Date | Status | Borrower | Loan Amount |
|---|---|---|---|
| Open | Fridlund Keith | $376,000 | |
| Previous Owner | Pieri Leonard A | $203,000 | |
| Closed | Pieri Leonard A | $65,000 | |
| Closed | Fridlund Keith | $70,500 |
Source: Public Records
Tax History
| Year | Tax Paid | Tax Assessment Tax Assessment Total Assessment is a certain percentage of the fair market value that is determined by local assessors to be the total taxable value of land and additions on the property. | Land | Improvement |
|---|---|---|---|---|
| 2025 | $8,540 | $736,822 | $564,046 | $172,776 |
| 2024 | $8,540 | $722,375 | $552,986 | $169,389 |
| 2023 | $8,270 | $708,211 | $542,143 | $166,068 |
| 2022 | $8,022 | $694,325 | $531,513 | $162,812 |
| 2021 | $7,802 | $680,711 | $521,091 | $159,620 |
| 2020 | $7,713 | $673,732 | $515,748 | $157,984 |
| 2019 | $7,548 | $660,522 | $505,635 | $154,887 |
| 2018 | $7,396 | $647,571 | $495,721 | $151,850 |
| 2017 | $7,344 | $634,874 | $486,001 | $148,873 |
| 2016 | $7,187 | $622,426 | $476,472 | $145,954 |
| 2015 | $7,118 | $613,077 | $469,315 | $143,762 |
| 2014 | $6,957 | $601,068 | $460,122 | $140,946 |
Source: Public Records
Map
Nearby Homes
- 469 Lenwood Cir
- 766 Tustin Ave Unit 5
- 2217 Laurel Place
- 600 Powell Place
- 2127 Cresta Dr
- 539 Tustin Ave
- 1173 Winslow Ln
- 625 Saint James Rd
- 308 E 18th St
- 1805 Clay St
- 430 Fullerton Ave
- 519 Signal Rd
- 425 Tustin Ave
- 405 El Modena Ave
- 268 E 18th St
- 1586 Orange Ave
- 1232 Blue Gum Ln
- 702 Saint James Place
- 401 Snug Harbor Rd
- 1581 Orange Ave Unit B
Your Personal Tour Guide
Ask me questions while you tour the home.