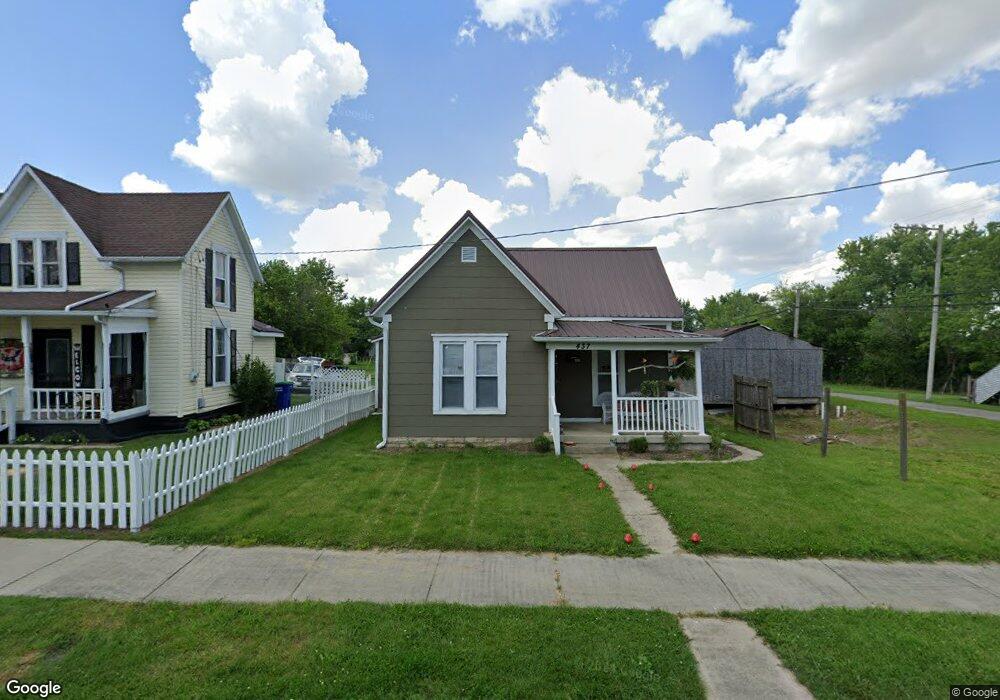
437 Spring St Greenfield, OH 45123
Estimated Value: $143,000 - $165,000
3
Beds
1
Bath
968
Sq Ft
$158/Sq Ft
Est. Value
About This Home
This home is located at 437 Spring St, Greenfield, OH 45123 and is currently estimated at $153,309, approximately $158 per square foot. 437 Spring St is a home located in Highland County with nearby schools including McClain High School.
Ownership History
Date
Name
Owned For
Owner Type
Purchase Details
Closed on
Dec 9, 2022
Sold by
Wareikis William A and Wareikis Mandy
Bought by
Proehl Zachery and Haubeil Summer
Current Estimated Value
Home Financials for this Owner
Home Financials are based on the most recent Mortgage that was taken out on this home.
Original Mortgage
$116,490
Outstanding Balance
$112,994
Interest Rate
6.95%
Mortgage Type
New Conventional
Estimated Equity
$40,315
Purchase Details
Closed on
Feb 25, 2022
Sold by
Raspberry Patch Llc
Bought by
Wareikis William A
Purchase Details
Closed on
Jan 14, 2016
Sold by
Park Enterprises Inc
Bought by
Raspberry Patch Llc
Purchase Details
Closed on
Feb 8, 2011
Sold by
Deatley Phyllis A
Bought by
Park Enterprises Inc
Purchase Details
Closed on
Jul 6, 1998
Sold by
Crago Helen L
Bought by
Deatley Herbert E and Deatley Phyllis A
Purchase Details
Closed on
Jan 1, 1990
Bought by
Crago Helen
Create a Home Valuation Report for This Property
The Home Valuation Report is an in-depth analysis detailing your home's value as well as a comparison with similar homes in the area
Home Values in the Area
Average Home Value in this Area
Purchase History
| Date | Buyer | Sale Price | Title Company |
|---|---|---|---|
| Proehl Zachery | $120,000 | -- | |
| Wareikis William A | $22,500 | None Listed On Document | |
| Raspberry Patch Llc | -- | None Available | |
| Park Enterprises Inc | $5,000 | Attorney | |
| Deatley Herbert E | $25,000 | -- | |
| Crago Helen | -- | -- |
Source: Public Records
Mortgage History
| Date | Status | Borrower | Loan Amount |
|---|---|---|---|
| Open | Proehl Zachery | $116,490 |
Source: Public Records
Tax History
| Year | Tax Paid | Tax Assessment Tax Assessment Total Assessment is a certain percentage of the fair market value that is determined by local assessors to be the total taxable value of land and additions on the property. | Land | Improvement |
|---|---|---|---|---|
| 2024 | $1,383 | $43,720 | $3,610 | $40,110 |
| 2023 | $1,392 | $4,730 | $3,120 | $1,610 |
| 2022 | $166 | $4,730 | $3,120 | $1,610 |
| 2021 | $159 | $4,730 | $3,120 | $1,610 |
| 2020 | $135 | $3,920 | $2,590 | $1,330 |
| 2019 | $137 | $3,920 | $2,590 | $1,330 |
| 2018 | $263 | $3,920 | $2,590 | $1,330 |
| 2017 | $177 | $5,010 | $2,590 | $2,420 |
| 2016 | $178 | $5,010 | $2,590 | $2,420 |
| 2015 | $287 | $5,010 | $2,590 | $2,420 |
| 2014 | $194 | $5,010 | $2,590 | $2,420 |
| 2013 | $759 | $5,010 | $2,590 | $2,420 |
Source: Public Records
Map
Nearby Homes
Your Personal Tour Guide
Ask me questions while you tour the home.