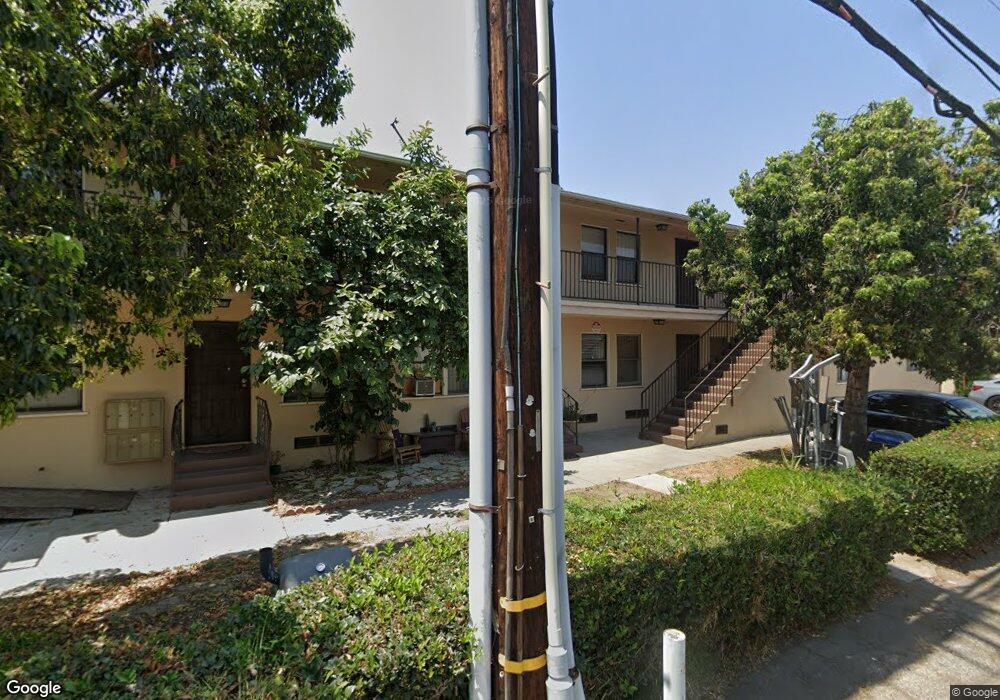
437 W 3rd St Unit 1 Long Beach, CA 90802
West Village NeighborhoodEstimated Value: $277,000 - $355,000
1
Bed
1
Bath
582
Sq Ft
$522/Sq Ft
Est. Value
About This Home
This home is located at 437 W 3rd St Unit 1, Long Beach, CA 90802 and is currently estimated at $303,732, approximately $521 per square foot. 437 W 3rd St Unit 1 is a home located in Los Angeles County with nearby schools including Cesar Chavez Elementary School, Washington Middle School, and Juan Rodriguez Cabrillo High School.
Ownership History
Date
Name
Owned For
Owner Type
Purchase Details
Closed on
May 7, 2004
Sold by
Barbosa Raul S
Bought by
Barbosa Robert M and Barbosa Peter J
Current Estimated Value
Home Financials for this Owner
Home Financials are based on the most recent Mortgage that was taken out on this home.
Original Mortgage
$40,000
Outstanding Balance
$18,754
Interest Rate
5.5%
Mortgage Type
Purchase Money Mortgage
Estimated Equity
$284,978
Purchase Details
Closed on
Mar 4, 2004
Sold by
Barbosa Raul S and Barbosa Connie
Bought by
Barbosa Raul S
Purchase Details
Closed on
Feb 26, 2003
Sold by
Saladino Mark J and Estate Of Gretchen C Marshall
Bought by
Barbosa Raul S and Barbosa Connie
Purchase Details
Closed on
Jun 6, 1995
Sold by
Cortez Ricardo H and Cortez Maria R
Bought by
Marshall G Charlotte
Purchase Details
Closed on
Apr 17, 1995
Sold by
Smith Ben J and Revocable Living Trust Of Ben
Bought by
Cortez Ricardo H and Cortez Maria R
Create a Home Valuation Report for This Property
The Home Valuation Report is an in-depth analysis detailing your home's value as well as a comparison with similar homes in the area
Home Values in the Area
Average Home Value in this Area
Purchase History
| Date | Buyer | Sale Price | Title Company |
|---|---|---|---|
| Barbosa Robert M | $75,000 | Fatcola | |
| Barbosa Peter J | -- | First American Title Co Los | |
| Barbosa Raul S | -- | -- | |
| Barbosa Raul S | $65,000 | Chicago | |
| Marshall G Charlotte | -- | -- | |
| Cortez Ricardo H | $29,000 | Southland Title |
Source: Public Records
Mortgage History
| Date | Status | Borrower | Loan Amount |
|---|---|---|---|
| Open | Barbosa Robert M | $40,000 |
Source: Public Records
Tax History
| Year | Tax Paid | Tax Assessment Tax Assessment Total Assessment is a certain percentage of the fair market value that is determined by local assessors to be the total taxable value of land and additions on the property. | Land | Improvement |
|---|---|---|---|---|
| 2025 | $1,652 | $106,611 | $45,485 | $61,126 |
| 2024 | $1,652 | $104,522 | $44,594 | $59,928 |
| 2023 | $1,619 | $102,473 | $43,720 | $58,753 |
| 2022 | $1,526 | $100,464 | $42,863 | $57,601 |
| 2021 | $1,467 | $98,495 | $42,023 | $56,472 |
| 2019 | $1,442 | $95,576 | $40,778 | $54,798 |
| 2018 | $1,398 | $93,703 | $39,979 | $53,724 |
| 2016 | $1,290 | $90,067 | $38,428 | $51,639 |
| 2015 | $1,242 | $88,715 | $37,851 | $50,864 |
| 2014 | $1,216 | $85,000 | $37,000 | $48,000 |
Source: Public Records
Map
Nearby Homes
- 437 W Sp 3a Carson St
- 327 Chestnut Ave Unit 104
- 327 Chestnut Ave Unit 201
- 315 W 3rd St Unit 710
- 315 W 3rd St Unit 410
- 335 Cedar Ave Unit 412
- 330 Cedar Ave
- 348 Daisy Ave
- 444 Chestnut Ave
- 321 Daisy Ave Unit 3
- 401 W 5th St Unit 3C
- 401 W 5th St Unit 3B
- 401 W 5th St Unit 1A
- 436 Cedar Ave Unit 15
- 617 W 3rd St
- 505 Cedar Ave Unit 2
- 640 W 4th St Unit 205
- 640 W 4th St Unit 101
- 640 W 4th St Unit 410
- 627 W 4th St
- 437 W 3rd St Unit 5
- 437 W 3rd St Unit 3
- 437 W 3rd St Unit 2
- 431 W 3rd St
- 429 W 3rd St Unit 7
- 429 W 3rd St Unit 6
- 429 W 3rd St Unit 4
- 322 N Virginia Ct
- 421 W 3rd St
- 421 W 3rd St
- 421 W 3rd St Unit 4
- 421 W 3rd St Unit 2
- 421 W 3rd St Unit 3
- 421 W 3rd St Unit 6
- 421 W 3rd St Unit 7
- 332 Magnolia Ave
- 335 N Virginia Ct
- 409 W 3rd St
- 409 W 3rd St
- 336 Magnolia Ave Unit A
Your Personal Tour Guide
Ask me questions while you tour the home.