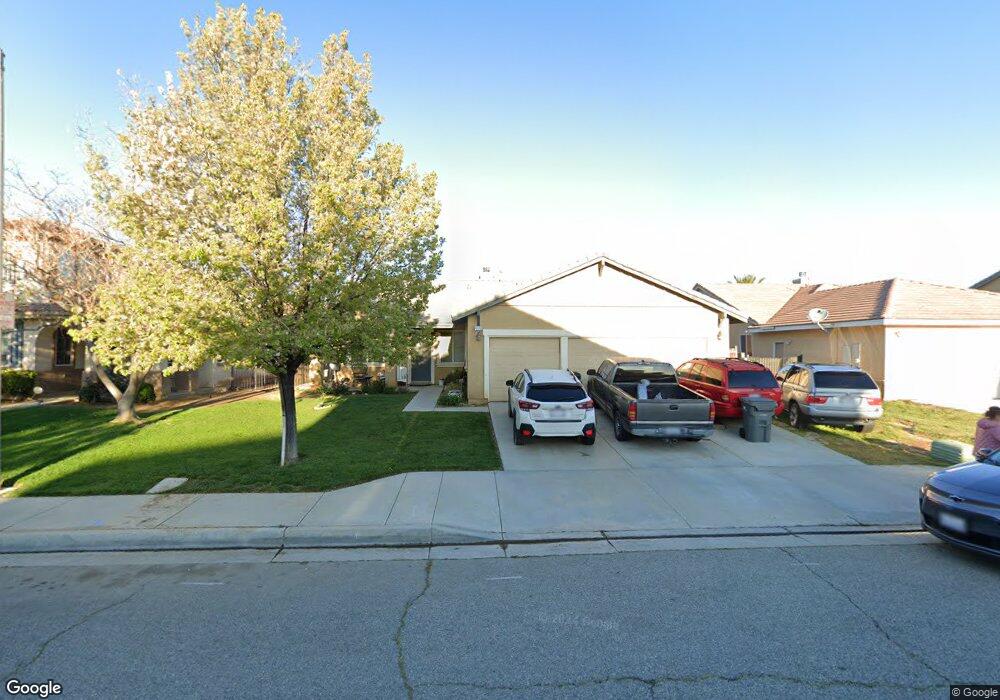
43705 Brandon Thomas Way Lancaster, CA 93536
West Lancaster NeighborhoodEstimated Value: $515,095 - $555,000
4
Beds
3
Baths
2,200
Sq Ft
$245/Sq Ft
Est. Value
About This Home
This home is located at 43705 Brandon Thomas Way, Lancaster, CA 93536 and is currently estimated at $538,774, approximately $244 per square foot. 43705 Brandon Thomas Way is a home located in Los Angeles County with nearby schools including Sundown Elementary School, Quartz Hill High School, and Fabunni Private School Inc..
Ownership History
Date
Name
Owned For
Owner Type
Purchase Details
Closed on
Jun 20, 2017
Sold by
Perdomo Dora Elia
Bought by
Estrada Alfredo and Estrada Guadalupe Cano
Current Estimated Value
Purchase Details
Closed on
Oct 6, 2010
Sold by
The Secretary Of Housing & Urban Develop
Bought by
Perdomo Dora Elia
Home Financials for this Owner
Home Financials are based on the most recent Mortgage that was taken out on this home.
Original Mortgage
$183,410
Interest Rate
4.87%
Mortgage Type
FHA
Purchase Details
Closed on
Mar 16, 2010
Sold by
Midfirst Bank
Bought by
Secretary Of Housing & Urban Development
Purchase Details
Closed on
Mar 11, 2010
Sold by
Bell Tina M
Bought by
Midfirst Bank
Purchase Details
Closed on
Nov 29, 2006
Sold by
Standard Pacific Corp
Bought by
Bell Tina M
Home Financials for this Owner
Home Financials are based on the most recent Mortgage that was taken out on this home.
Original Mortgage
$330,641
Interest Rate
6.32%
Mortgage Type
FHA
Create a Home Valuation Report for This Property
The Home Valuation Report is an in-depth analysis detailing your home's value as well as a comparison with similar homes in the area
Home Values in the Area
Average Home Value in this Area
Purchase History
| Date | Buyer | Sale Price | Title Company |
|---|---|---|---|
| Estrada Alfredo | -- | None Available | |
| Perdomo Dora Elia | $175,000 | Ticor Title Company | |
| Secretary Of Housing & Urban Development | -- | Lsi Title Company | |
| Midfirst Bank | $368,531 | Accommodation | |
| Bell Tina M | $362,000 | Lawyers Title |
Source: Public Records
Mortgage History
| Date | Status | Borrower | Loan Amount |
|---|---|---|---|
| Previous Owner | Perdomo Dora Elia | $183,410 | |
| Previous Owner | Bell Tina M | $330,641 |
Source: Public Records
Tax History
| Year | Tax Paid | Tax Assessment Tax Assessment Total Assessment is a certain percentage of the fair market value that is determined by local assessors to be the total taxable value of land and additions on the property. | Land | Improvement |
|---|---|---|---|---|
| 2025 | $6,263 | $407,494 | $101,510 | $305,984 |
| 2024 | $6,263 | $399,505 | $99,520 | $299,985 |
| 2023 | $6,199 | $391,672 | $97,569 | $294,103 |
| 2022 | $6,063 | $383,993 | $95,656 | $288,337 |
| 2021 | $5,622 | $376,465 | $93,781 | $282,684 |
| 2019 | $5,477 | $365,300 | $91,000 | $274,300 |
| 2018 | $3,852 | $231,383 | $57,421 | $173,962 |
| 2016 | $3,648 | $222,400 | $55,193 | $167,207 |
| 2015 | $3,607 | $219,060 | $54,364 | $164,696 |
| 2014 | $3,591 | $214,770 | $53,300 | $161,470 |
Source: Public Records
Map
Nearby Homes
- 6147 W Avenue j15
- 6223 W Avenue j12
- 6105 W Avenue K
- 43815 Encanto Way
- 43637 59th St W
- 5829 Spice St
- 43869 Hampton St
- 6304 Starview Dr
- 5818 W Avenue j15
- 6105 W Avenue k4
- 0 Vac Cor Ave K4 85th
- 43407 Hampton St
- 5832 W Avenue K-2
- 5741 Spice St
- 0 61st St W
- 60 Stw Vic Ave
- 0 65th St West and J8 Unit 25002929
- 5659 W Avenue j15
- 5645 W Avenue j15
- 0 Vic Avenue J12 67 Stw
- 43713 Brandon Thomas Way
- 43701 Brandon Thomas Way
- 43702 Grandpark Ave
- 43708 Grandpark Ave
- 43656 Grandpark Ave
- 43719 Brandon Thomas Way
- 43655 Brandon Thomas Way
- 6148 W Avenue J14-City of Lancaster
- 6148 W Avenue j14
- 43714 Grandpark Ave
- 43650 Grandpark Ave
- 43725 Brandon Thomas Way
- 6142 W Avenue j14
- 43722 Grandpark Ave
- 6147 W Avenue j14
- 43644 Grandpark Ave
- 6141 W Avenue j15
- 43733 Brandon Thomas Way
- 43643 Brandon Thomas Way
- 43703 Grandpark Ave
Your Personal Tour Guide
Ask me questions while you tour the home.