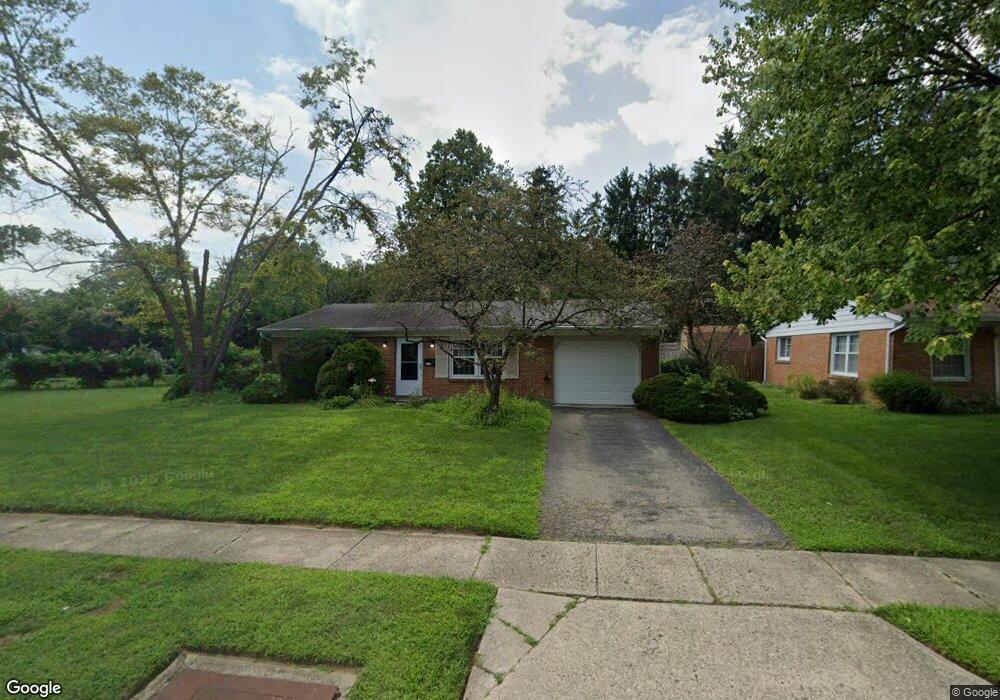
4371 Meadowcroft Rd Dayton, OH 45429
Estimated Value: $207,000 - $224,000
3
Beds
2
Baths
1,233
Sq Ft
$175/Sq Ft
Est. Value
About This Home
This home is located at 4371 Meadowcroft Rd, Dayton, OH 45429 and is currently estimated at $215,762, approximately $174 per square foot. 4371 Meadowcroft Rd is a home located in Montgomery County with nearby schools including John F. Kennedy Elementary School, Kettering Middle School, and Kettering Fairmont High School.
Ownership History
Date
Name
Owned For
Owner Type
Purchase Details
Closed on
Jul 29, 2013
Sold by
Abraham Jai and Abraham Sini I
Bought by
Baker Nicholas A
Current Estimated Value
Home Financials for this Owner
Home Financials are based on the most recent Mortgage that was taken out on this home.
Original Mortgage
$98,090
Outstanding Balance
$70,647
Interest Rate
3.62%
Mortgage Type
FHA
Estimated Equity
$145,115
Purchase Details
Closed on
Feb 28, 2005
Sold by
Felty Gene G and Felty Davie L
Bought by
Abraham Jai and Abraham Sini I
Home Financials for this Owner
Home Financials are based on the most recent Mortgage that was taken out on this home.
Original Mortgage
$113,998
Interest Rate
5.7%
Mortgage Type
FHA
Purchase Details
Closed on
Feb 8, 2000
Sold by
Schaut Jeffrey M and Schaut Gina R
Bought by
Felty Gene G and Felty Davie L
Create a Home Valuation Report for This Property
The Home Valuation Report is an in-depth analysis detailing your home's value as well as a comparison with similar homes in the area
Home Values in the Area
Average Home Value in this Area
Purchase History
| Date | Buyer | Sale Price | Title Company |
|---|---|---|---|
| Baker Nicholas A | $99,900 | None Available | |
| Abraham Jai | $114,900 | None Available | |
| Felty Gene G | $70,000 | -- |
Source: Public Records
Mortgage History
| Date | Status | Borrower | Loan Amount |
|---|---|---|---|
| Open | Baker Nicholas A | $98,090 | |
| Previous Owner | Abraham Jai | $113,998 |
Source: Public Records
Tax History Compared to Growth
Tax History
| Year | Tax Paid | Tax Assessment Tax Assessment Total Assessment is a certain percentage of the fair market value that is determined by local assessors to be the total taxable value of land and additions on the property. | Land | Improvement |
|---|---|---|---|---|
| 2024 | $3,066 | $49,340 | $9,860 | $39,480 |
| 2023 | $3,066 | $49,340 | $9,860 | $39,480 |
| 2022 | $3,035 | $38,640 | $7,700 | $30,940 |
| 2021 | $2,808 | $38,640 | $7,700 | $30,940 |
| 2020 | $2,817 | $38,640 | $7,700 | $30,940 |
| 2019 | $2,515 | $30,490 | $7,000 | $23,490 |
| 2018 | $2,529 | $30,490 | $7,000 | $23,490 |
| 2017 | $2,330 | $30,490 | $7,000 | $23,490 |
| 2016 | $2,425 | $29,840 | $7,000 | $22,840 |
| 2015 | $2,317 | $29,840 | $7,000 | $22,840 |
| 2014 | $2,317 | $29,840 | $7,000 | $22,840 |
| 2012 | -- | $33,180 | $7,700 | $25,480 |
Source: Public Records
Map
Nearby Homes
- 4307 Meadowcroft Rd
- 1328 Willowdale Ave
- 4244 Flowerdale Ave
- 1310 Partridge Run Cir Unit 1310
- 4640 Marshall Rd
- 1008 Rio Ln
- 1013 Swango Dr
- 1105 Greenridge Dr
- 2021 Stayman Dr
- 1049 Georgian Dr
- 1040 Kenosha Rd
- 3872 Maryknoll Dr
- 959 Kimberly Dr
- 1118 Gardner Rd
- 3725 Claybourne Rd
- 3736 Valleywood Dr
- 4190 Woodman Dr
- 5155 Marshall Rd
- 804 Lovetta Dr
- 4817 Ackerman Blvd
- 4363 Meadowcroft Rd
- 4379 Meadowcroft Rd
- 4355 Meadowcroft Rd
- 4420 Flowerdale Ave
- 4420 Flowerdale Ave
- 4420 Flowerdale Ave Unit G
- 4420 Flowerdale Ave Unit D
- 4370 Meadowcroft Rd
- 4387 Meadowcroft Rd
- 4362 Meadowcroft Rd
- 4347 Meadowcroft Rd
- 4354 Meadowcroft Rd
- 4370-4440 Flowerdale Ave
- 4440 Flowerdale Ave Unit B
- 4440 Flowerdale Ave
- 4440 Flowerdale Ave Unit D
- 4401 Meadowcroft Rd
- 4339 Meadowcroft Rd
- 4346 Meadowcroft Rd
- 1325 E David Rd