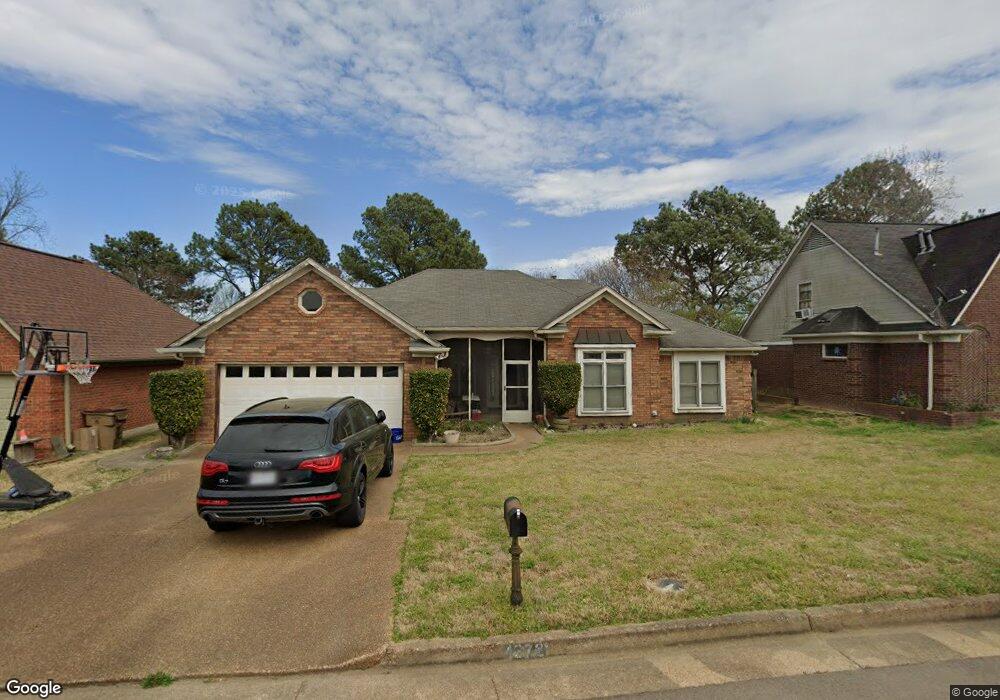
4372 Donnegan Cove Memphis, TN 38125
Southern Shelby County NeighborhoodEstimated Value: $230,000 - $258,764
3
Beds
2
Baths
1,770
Sq Ft
$138/Sq Ft
Est. Value
About This Home
This home is located at 4372 Donnegan Cove, Memphis, TN 38125 and is currently estimated at $244,191, approximately $137 per square foot. 4372 Donnegan Cove is a home located in Shelby County with nearby schools including Lowrance Elementary School, Southwind High School, and Christ the Rock Christian Academy.
Ownership History
Date
Name
Owned For
Owner Type
Purchase Details
Closed on
Jan 16, 2022
Sold by
Tate Jamel S
Bought by
Tate Jamel S
Current Estimated Value
Purchase Details
Closed on
Nov 26, 2007
Sold by
Residential Funding Co Llc
Bought by
Tate Jamel S
Home Financials for this Owner
Home Financials are based on the most recent Mortgage that was taken out on this home.
Original Mortgage
$109,900
Interest Rate
6.21%
Mortgage Type
Purchase Money Mortgage
Purchase Details
Closed on
Sep 6, 2007
Sold by
Evans Latoya Tyna
Bought by
Residential Funding Co Llc
Purchase Details
Closed on
Jan 31, 2005
Sold by
Cendant Mobility Government Financial Se
Bought by
Evans Latoya Tyna
Home Financials for this Owner
Home Financials are based on the most recent Mortgage that was taken out on this home.
Original Mortgage
$99,960
Interest Rate
7.25%
Mortgage Type
Purchase Money Mortgage
Purchase Details
Closed on
Oct 16, 2004
Sold by
Hairel Vicky L and Kruse Vicky L
Bought by
Cendant Mobility Government Financial Se and Burrow Closing Management Corp
Create a Home Valuation Report for This Property
The Home Valuation Report is an in-depth analysis detailing your home's value as well as a comparison with similar homes in the area
Home Values in the Area
Average Home Value in this Area
Purchase History
| Date | Buyer | Sale Price | Title Company |
|---|---|---|---|
| Tate Jamel S | -- | Vidmar & Hardesty Ltd | |
| Tate Jamel S | $109,900 | Realty Title & Escrow | |
| Residential Funding Co Llc | $102,000 | None Available | |
| Residential Funding Co Llc | $102,000 | None Available | |
| Evans Latoya Tyna | $124,950 | Mid South Title Agency Inc | |
| Cendant Mobility Government Financial Se | $124,950 | -- |
Source: Public Records
Mortgage History
| Date | Status | Borrower | Loan Amount |
|---|---|---|---|
| Previous Owner | Tate Jamel S | $109,900 | |
| Previous Owner | Evans Latoya Tyna | $99,960 | |
| Closed | Evans Latoya Tyna | $24,990 |
Source: Public Records
Tax History Compared to Growth
Tax History
| Year | Tax Paid | Tax Assessment Tax Assessment Total Assessment is a certain percentage of the fair market value that is determined by local assessors to be the total taxable value of land and additions on the property. | Land | Improvement |
|---|---|---|---|---|
| 2025 | $1,487 | $62,800 | $12,375 | $50,425 |
| 2024 | $1,487 | $43,850 | $6,950 | $36,900 |
| 2023 | $1,487 | $43,850 | $6,950 | $36,900 |
| 2022 | $1,487 | $43,850 | $6,950 | $36,900 |
| 2021 | $1,513 | $43,850 | $6,950 | $36,900 |
| 2020 | $1,353 | $33,400 | $6,950 | $26,450 |
| 2019 | $1,353 | $33,400 | $6,950 | $26,450 |
| 2018 | $1,353 | $33,400 | $6,950 | $26,450 |
| 2017 | $1,373 | $33,400 | $6,950 | $26,450 |
| 2016 | $1,194 | $27,325 | $0 | $0 |
| 2014 | $1,194 | $27,325 | $0 | $0 |
Source: Public Records
Map
Nearby Homes
- 4316 Barry Meadows Cove
- 4333 Rainey Woods Cove
- 4419 Berkley Woods Dr
- 4471 Hughes Meadow Dr
- 4646 Sweet Whisper Ln
- 4294 Thunderstone Cir W
- 4411 Alixs Dr
- 3988 Fern Valley Dr
- 4028 Long Creek Rd
- 4075 Muirfield Dr
- 1578 Southern Hill Dr
- 4022 Muirfield Dr
- 7555 Windsong Dr
- 7875 Fallstone Rd
- 7527 Wilsford Cove
- 7561 Shelby Cross Cir
- 3968 Sawgrass Dr
- 3912 Autumn Harvest Ln
- 3821 Misty Oak Dr
- 7421 Richmond Rd
- 4378 Donnegan Cove
- 4366 Donnegan Cove
- 4358 Donnegan Cove
- 4375 Donnegan Cove
- 4384 Donnegan Cove
- 4367 Donnegan Cove
- 4393 Donnegan Cove
- 4359 Donnegan Cove
- 4352 Donnegan Cove
- 4390 Donnegan Cove
- 4374 Barrymor Dr
- 4368 Barrymor Dr
- 4398 Donnegan Cove
- 4382 Barrymor Dr
- 4353 Donnegan Cove
- 4360 Barrymor Dr
- 4404 Donnegan Cove
- 7984 Tankerston Dr
- 4410 Donnegan Cove
- 3999 Riverdale Bend Rd