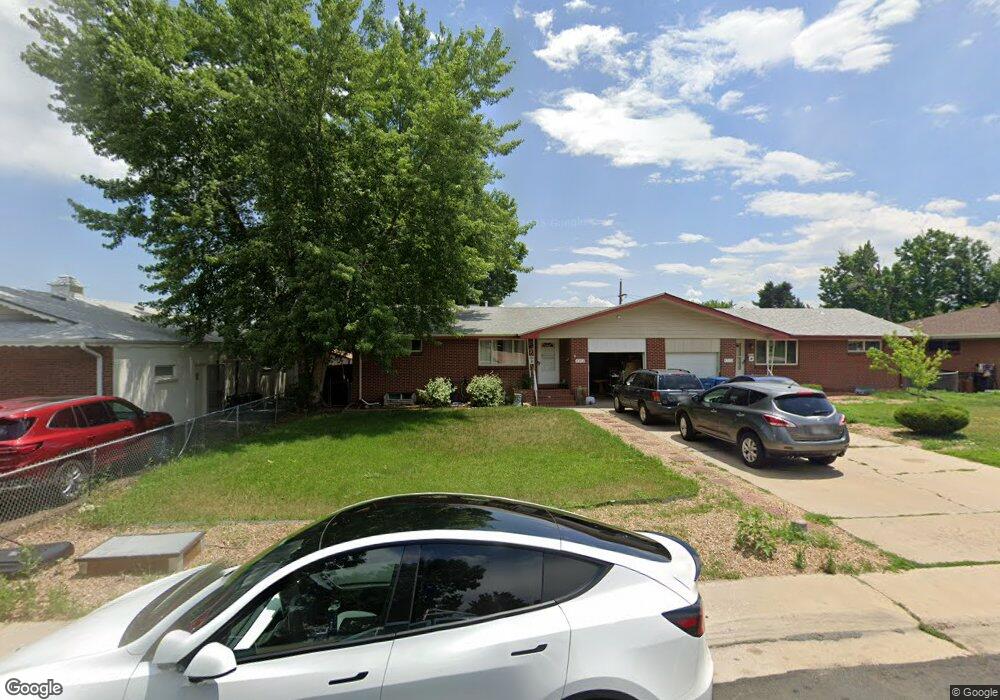
4372 Quay St Wheat Ridge, CO 80033
Barths NeighborhoodEstimated Value: $445,000 - $570,000
3
Beds
2
Baths
1,007
Sq Ft
$498/Sq Ft
Est. Value
About This Home
This home is located at 4372 Quay St, Wheat Ridge, CO 80033 and is currently estimated at $501,870, approximately $498 per square foot. 4372 Quay St is a home located in Jefferson County with nearby schools including Stevens Elementary School, Everitt Middle School, and Wheat Ridge High School.
Ownership History
Date
Name
Owned For
Owner Type
Purchase Details
Closed on
Sep 11, 2021
Sold by
Veasman Jean Patricia
Bought by
Bull Cheryl and Veasman Jean Patricia
Current Estimated Value
Home Financials for this Owner
Home Financials are based on the most recent Mortgage that was taken out on this home.
Original Mortgage
$288,461
Outstanding Balance
$262,478
Interest Rate
2.8%
Mortgage Type
FHA
Estimated Equity
$239,392
Purchase Details
Closed on
Apr 21, 2000
Sold by
Pfenning Sharon E and Green Jeffrey D
Bought by
Veasman Jean Patricia
Home Financials for this Owner
Home Financials are based on the most recent Mortgage that was taken out on this home.
Original Mortgage
$114,000
Interest Rate
8.24%
Purchase Details
Closed on
Jul 29, 1999
Sold by
Neighborhood Investments Inc
Bought by
Green Jeffrey D and Pfenning Sharon E
Home Financials for this Owner
Home Financials are based on the most recent Mortgage that was taken out on this home.
Original Mortgage
$158,641
Interest Rate
7.63%
Mortgage Type
FHA
Create a Home Valuation Report for This Property
The Home Valuation Report is an in-depth analysis detailing your home's value as well as a comparison with similar homes in the area
Home Values in the Area
Average Home Value in this Area
Purchase History
| Date | Buyer | Sale Price | Title Company |
|---|---|---|---|
| Bull Cheryl | -- | Amrock Inc | |
| Veasman Jean Patricia | $164,000 | -- | |
| Green Jeffrey D | $159,950 | -- |
Source: Public Records
Mortgage History
| Date | Status | Borrower | Loan Amount |
|---|---|---|---|
| Open | Bull Cheryl | $288,461 | |
| Closed | Veasman Jean Patricia | $114,000 | |
| Previous Owner | Green Jeffrey D | $158,641 |
Source: Public Records
Tax History Compared to Growth
Tax History
| Year | Tax Paid | Tax Assessment Tax Assessment Total Assessment is a certain percentage of the fair market value that is determined by local assessors to be the total taxable value of land and additions on the property. | Land | Improvement |
|---|---|---|---|---|
| 2024 | $2,630 | $30,080 | $12,737 | $17,343 |
| 2023 | $2,630 | $30,080 | $12,737 | $17,343 |
| 2022 | $1,806 | $27,239 | $13,229 | $14,010 |
| 2021 | $1,831 | $28,022 | $13,609 | $14,413 |
| 2020 | $1,555 | $24,957 | $12,264 | $12,693 |
| 2019 | $1,534 | $24,957 | $12,264 | $12,693 |
| 2018 | $1,285 | $21,626 | $7,674 | $13,952 |
| 2017 | $1,161 | $21,626 | $7,674 | $13,952 |
| 2016 | $749 | $16,665 | $5,012 | $11,653 |
| 2015 | $617 | $16,665 | $5,012 | $11,653 |
| 2014 | $617 | $13,472 | $4,628 | $8,844 |
Source: Public Records
Map
Nearby Homes
- 7010 W 44th Ave
- 4125 Pierce St
- 4420 Teller St
- 4095 Quay St
- 4541 Reed St
- 4014 Upham St
- 4026 Upham St
- 4024 Upham St
- 4008 Upham St
- 3830 Pierce St
- 3820 Pierce St
- 3830 Otis St Unit 1-4
- 6920 W 47th Place
- 4730 Pierce St
- 4635 Teller St
- 4730 Otis St
- 6920 W 48th Ave Unit 6920
- 6455 W 38th Ave
- 6735 W 37th Place
- 4295 Harlan St