Estimated Value: $1,638,000 - $2,323,000
3
Beds
1
Bath
1,250
Sq Ft
$1,563/Sq Ft
Est. Value
About This Home
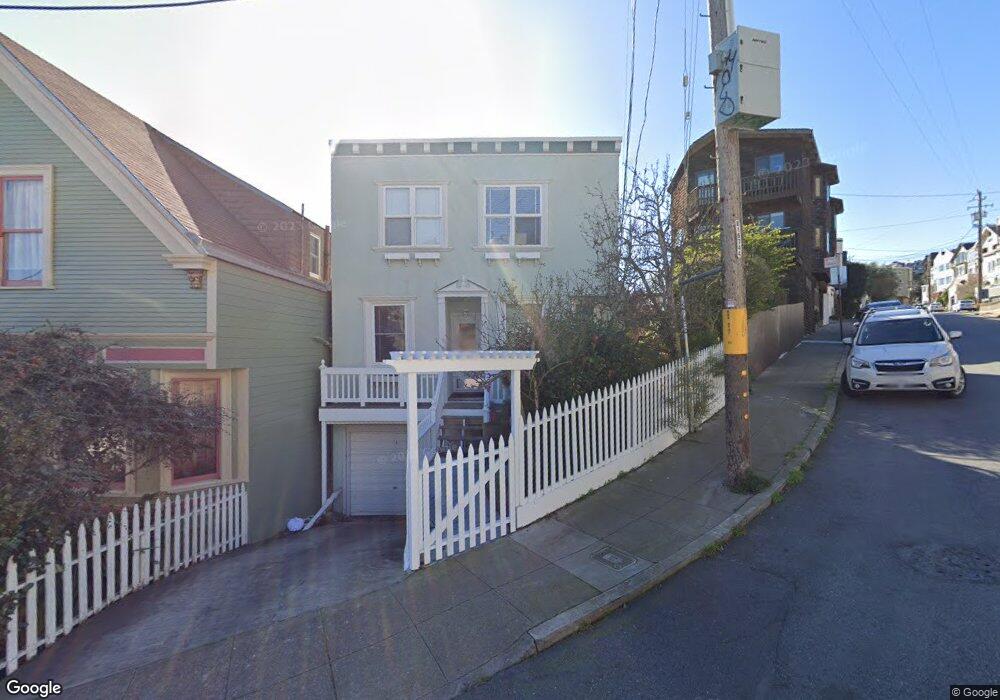
This home is located at 4373 21st St, San Francisco, CA 94114 and is currently estimated at $1,954,322, approximately $1,563 per square foot. 4373 21st St is a home located in San Francisco County with nearby schools including Harvey Milk Civil Rights Academy, Everett Middle School, and Thomas Edison Charter Academy.
Ownership History
Date
Name
Owned For
Owner Type
Purchase Details
Closed on
Oct 12, 2006
Sold by
Papkoff Jacqueline S
Bought by
Papkoff Jackie
Current Estimated Value
Purchase Details
Closed on
Mar 5, 2002
Sold by
Thomas Stephen D and Ishihara Hiromi
Bought by
Papkoff Jacqueline S
Home Financials for this Owner
Home Financials are based on the most recent Mortgage that was taken out on this home.
Original Mortgage
$375,000
Interest Rate
6.49%
Purchase Details
Closed on
Dec 10, 1999
Sold by
Wally Lisa N and Ridley Eileen R
Bought by
Thomas Stephen D and Ishihara Hiromi
Home Financials for this Owner
Home Financials are based on the most recent Mortgage that was taken out on this home.
Original Mortgage
$270,000
Interest Rate
7.37%
Create a Home Valuation Report for This Property
The Home Valuation Report is an in-depth analysis detailing your home's value as well as a comparison with similar homes in the area
Home Values in the Area
Average Home Value in this Area
Purchase History
| Date | Buyer | Sale Price | Title Company |
|---|---|---|---|
| Papkoff Jackie | -- | None Available | |
| Papkoff Jacqueline S | $873,000 | Chicago Title Co | |
| Thomas Stephen D | $510,000 | Fidelity National Title Co |
Source: Public Records
Mortgage History
| Date | Status | Borrower | Loan Amount |
|---|---|---|---|
| Closed | Papkoff Jacqueline S | $375,000 | |
| Previous Owner | Thomas Stephen D | $270,000 |
Source: Public Records
Tax History Compared to Growth
Tax History
| Year | Tax Paid | Tax Assessment Tax Assessment Total Assessment is a certain percentage of the fair market value that is determined by local assessors to be the total taxable value of land and additions on the property. | Land | Improvement |
|---|---|---|---|---|
| 2025 | $14,973 | $1,301,234 | $773,803 | $527,431 |
| 2024 | $14,973 | $1,275,722 | $758,631 | $517,091 |
| 2023 | $14,758 | $1,250,709 | $743,756 | $506,953 |
| 2022 | $14,494 | $1,226,186 | $729,173 | $497,013 |
| 2021 | $14,243 | $1,202,145 | $714,876 | $487,269 |
| 2020 | $14,287 | $1,189,820 | $707,546 | $482,274 |
| 2019 | $14,404 | $1,166,492 | $693,673 | $472,819 |
| 2018 | $13,917 | $1,143,621 | $680,072 | $463,549 |
| 2017 | $13,454 | $1,121,199 | $666,738 | $454,461 |
| 2016 | $13,231 | $1,099,216 | $653,665 | $445,551 |
| 2015 | $13,067 | $1,082,707 | $643,847 | $438,860 |
| 2014 | $12,721 | $1,061,500 | $631,235 | $430,265 |
Source: Public Records
Map
Nearby Homes
- 1 Hoffman Ave Unit A
- 3711 Market St Unit 2
- 584 Douglass St
- 767 Corbett Ave Unit 3
- 755 Corbett Ave
- 4229 21st St
- 672 Corbett Ave Unit C
- 417-419 Eureka St
- 4454 23rd St Unit 2
- 892 Corbett Ave
- 833 Corbett Ave
- 4031 22nd St
- 3890 Market St Unit 1
- 930 Elizabeth St Unit 1
- 160 Gardenside Dr Unit 101
- 49 Seward St Unit 1
- 308 Diamond St
- 335 Diamond St
- 734 Elizabeth St
- 945 Corbett Ave Unit 206
- 4371 21st St
- 30 Worth St
- 4369 21st St
- 217 Grand View Ave
- 36 Worth St
- 18 Worth St
- 4367 21st St
- 40 Worth St
- 221 Grand View Ave
- 44 Worth St
- 225 Grand View Ave
- 48 Worth St
- 178 Grand View Ave Unit 4
- 178 Grand View Ave Unit 3
- 178 Grand View Ave Unit 2
- 178 Grand View Ave Unit 1
- 229 Grand View Ave Unit 233
- 188 Grand View Ave
- 192 Grand View Ave
- 182 Grand View Ave