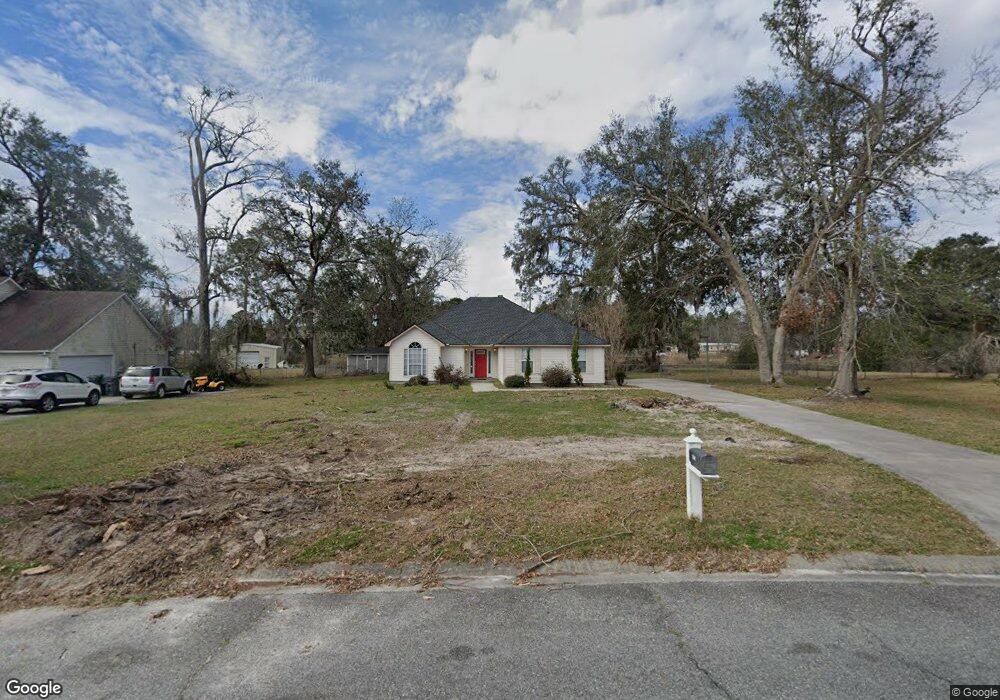
4373 Summerlin Dr Valdosta, GA 31605
Estimated Value: $241,000 - $271,000
4
Beds
2
Baths
1,890
Sq Ft
$137/Sq Ft
Est. Value
About This Home
This home is located at 4373 Summerlin Dr, Valdosta, GA 31605 and is currently estimated at $258,697, approximately $136 per square foot. 4373 Summerlin Dr is a home located in Lowndes County with nearby schools including Moulton-Branch Elementary School, Pine Grove Middle School, and Lowndes High School.
Ownership History
Date
Name
Owned For
Owner Type
Purchase Details
Closed on
Dec 22, 2017
Sold by
Devincenzi Challis
Bought by
Devincenzi Edward L
Current Estimated Value
Purchase Details
Closed on
Jul 13, 2015
Sold by
Reaves William T
Bought by
Devincenzi Edward L and Devincenzi Challis
Home Financials for this Owner
Home Financials are based on the most recent Mortgage that was taken out on this home.
Original Mortgage
$121,047
Interest Rate
4.08%
Mortgage Type
VA
Purchase Details
Closed on
Mar 29, 2004
Sold by
Ogilby Chris
Bought by
Reaves William T and Reaves Pamela T
Purchase Details
Closed on
Apr 30, 2002
Sold by
Boice Michael W
Bought by
Ogilby Chris
Purchase Details
Closed on
Mar 26, 2002
Sold by
Boice Michael W and Boice Tara
Bought by
Boice Michael W
Purchase Details
Closed on
Apr 29, 1999
Sold by
Dhr Inc
Bought by
Boice Michael W and Boice Tara
Purchase Details
Closed on
Oct 16, 1997
Bought by
Dhr Inc
Create a Home Valuation Report for This Property
The Home Valuation Report is an in-depth analysis detailing your home's value as well as a comparison with similar homes in the area
Home Values in the Area
Average Home Value in this Area
Purchase History
| Date | Buyer | Sale Price | Title Company |
|---|---|---|---|
| Devincenzi Edward L | -- | -- | |
| Devincenzi Edward L | $118,500 | -- | |
| Reaves William T | $115,000 | -- | |
| Ogilby Chris | $103,500 | -- | |
| Boice Michael W | -- | -- | |
| Boice Michael W | $106,500 | -- | |
| Dhr Inc | -- | -- |
Source: Public Records
Mortgage History
| Date | Status | Borrower | Loan Amount |
|---|---|---|---|
| Previous Owner | Devincenzi Edward L | $121,047 |
Source: Public Records
Tax History Compared to Growth
Tax History
| Year | Tax Paid | Tax Assessment Tax Assessment Total Assessment is a certain percentage of the fair market value that is determined by local assessors to be the total taxable value of land and additions on the property. | Land | Improvement |
|---|---|---|---|---|
| 2024 | $2,064 | $84,962 | $11,800 | $73,162 |
| 2023 | $2,064 | $79,027 | $11,800 | $67,227 |
| 2022 | $1,639 | $57,443 | $11,800 | $45,643 |
| 2021 | $1,710 | $57,453 | $11,800 | $45,653 |
| 2020 | $1,552 | $56,025 | $11,800 | $44,225 |
| 2019 | $1,415 | $50,408 | $11,800 | $38,608 |
| 2018 | $1,429 | $50,418 | $11,800 | $38,618 |
| 2017 | $1,445 | $50,427 | $11,800 | $38,627 |
| 2016 | $1,360 | $50,437 | $11,800 | $38,637 |
| 2015 | $1,465 | $53,232 | $11,800 | $41,432 |
| 2014 | $1,494 | $53,232 | $11,800 | $41,432 |
Source: Public Records
Map
Nearby Homes
- 3937 Studstill Rd
- 3915 Studstill Rd
- 6416 Abney Ct
- 6408 Abney Ct
- 6424 Abney Ct
- 6428 Abney Ct
- 4035 Stratford Cir
- 3885 Brookfield Dr
- 4008 Muirfield Ln
- 3920 Bull Run
- 3967 Stratford Cir
- 3917 Valiant Ct
- 3789 Heatherwoods Dr
- 3735 Studstill Rd
- 3853 Stratford Cir
- 3376 Bemiss Knights Academy Rd
- 3747 Robin Ln
- 3713 Robin Ln
- 3904 Countess Ct
- 4581 4595 Bemiss Rd
- 4369 Summerlin Dr
- 4377 Summerlin Dr
- 4381 Summerlin Dr
- 4370 Summerlin Dr
- 4287 Shadowwood Dr
- 4283 Shadowwood Dr
- 4384 Summerlin Dr
- 4366 Summerlin Dr
- 4385 Summerlin Dr
- 3687 Bemiss Knights Academy Rd
- 4279 Shadowwood Dr
- 4362 Summerlin Dr
- 4275 Shadowwood Dr
- 4388 Summerlin Dr
- 4359 Summerlin Dr
- 4389 Summerlin Dr
- 4513 Windward Ct
- 4517 Windward Ct
- 4358 Summerlin Dr
- 4267 Shadowwood Dr