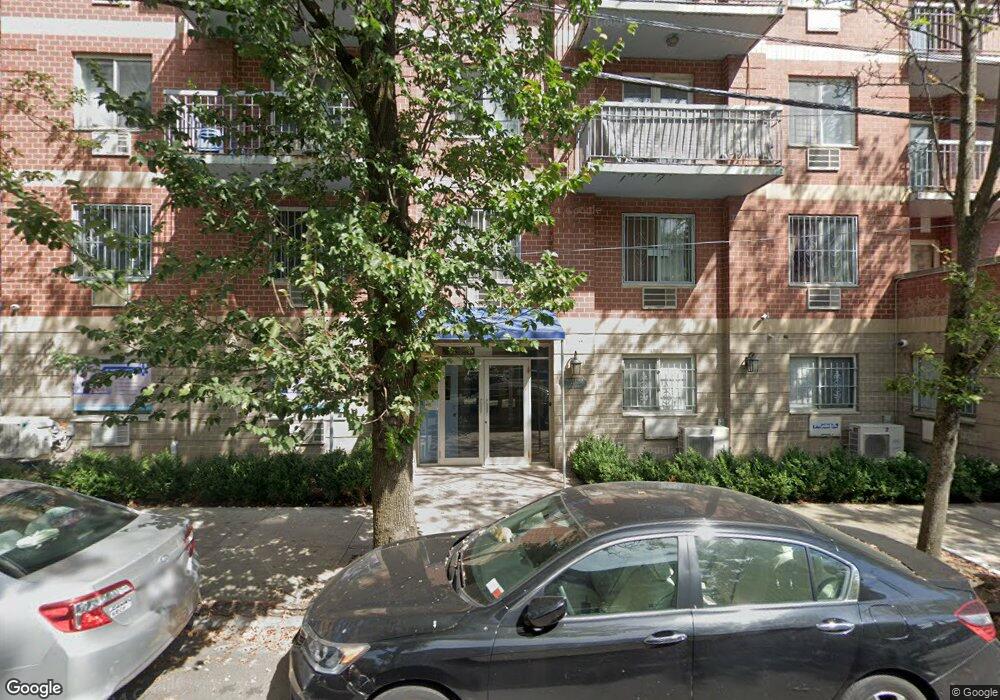
4373 Union St Unit 3B Flushing, NY 11355
Flushing NeighborhoodEstimated Value: $394,077 - $511,000
--
Bed
--
Bath
515
Sq Ft
$881/Sq Ft
Est. Value
About This Home
This home is located at 4373 Union St Unit 3B, Flushing, NY 11355 and is currently estimated at $453,769, approximately $881 per square foot. 4373 Union St Unit 3B is a home located in Queens County with nearby schools including P.S. 024 Andrew Jackson School, Rachel Carson I.S. 237Q, and John Bowne High School.
Ownership History
Date
Name
Owned For
Owner Type
Purchase Details
Closed on
Dec 29, 2011
Sold by
Hu Guo Mian and Hu Jing Jing
Bought by
Hu Jing Jing
Current Estimated Value
Purchase Details
Closed on
Apr 10, 2008
Sold by
Chan Philip
Bought by
Hu Guo Mian and Hu Jing Jing
Create a Home Valuation Report for This Property
The Home Valuation Report is an in-depth analysis detailing your home's value as well as a comparison with similar homes in the area
Home Values in the Area
Average Home Value in this Area
Purchase History
| Date | Buyer | Sale Price | Title Company |
|---|---|---|---|
| Hu Jing Jing | -- | -- | |
| Hu Guo Mian | $271,000 | -- |
Source: Public Records
Tax History Compared to Growth
Tax History
| Year | Tax Paid | Tax Assessment Tax Assessment Total Assessment is a certain percentage of the fair market value that is determined by local assessors to be the total taxable value of land and additions on the property. | Land | Improvement |
|---|---|---|---|---|
| 2025 | $2,855 | $26,663 | $2,924 | $23,739 |
| 2024 | $2,876 | $25,156 | $2,924 | $22,232 |
| 2023 | $3,270 | $28,474 | $2,924 | $25,550 |
| 2022 | $2,928 | $26,383 | $2,924 | $23,459 |
| 2021 | $3,009 | $26,900 | $2,924 | $23,976 |
| 2020 | $3,057 | $30,725 | $2,924 | $27,801 |
| 2019 | $2,820 | $29,426 | $2,924 | $26,502 |
| 2018 | $2,621 | $22,938 | $2,924 | $20,014 |
| 2017 | $2,542 | $21,704 | $2,924 | $18,780 |
| 2016 | $2,312 | $21,704 | $2,924 | $18,780 |
| 2015 | $329 | $19,242 | $2,924 | $16,318 |
| 2014 | $329 | $17,654 | $2,924 | $14,730 |
Source: Public Records
Map
Nearby Homes
- 44-69 Kissena Blvd Unit 2P
- 44-69 Kissena Blvd Unit 4M
- 44-59 Kissena Blvd Unit 6N
- 44-55 Kissena Blvd Unit 3B
- 137-77 45th Ave Unit 4H
- 137-77 45th Ave Unit 6P
- 138-70 Elder Ave Unit 1W
- 138-70 Elder Ave Unit 3A
- 138-70 Elder Ave Unit 7H
- 138-70 Elder Ave Unit 3C
- 142-03 45th Ave
- 43-36 Robinson St Unit 4F
- 43-36 Robinson St Unit 5L
- 142-05 45th Ave
- 43-20 Union St Unit 7
- 43-20 Union St Unit 6D
- 14209 45th Ave
- 4317 Union St Unit 4E
- 4317 Union St Unit 2B
- 43-17 Union St Unit 6C
- 4373 Union St Unit 7C
- 4373 Union St Unit 7B
- 4373 Union St Unit 7A
- 4373 Union St Unit 6D
- 4373 Union St Unit 6C
- 4373 Union St Unit 6B
- 4373 Union St Unit 6A
- 4373 Union St Unit 5D
- 4373 Union St Unit 5C
- 4373 Union St Unit 5B
- 4373 Union St Unit 5A
- 4373 Union St Unit 4D
- 4373 Union St Unit 4C
- 4373 Union St Unit 4B
- 4373 Union St Unit 4A
- 4373 Union St Unit 3D
- 4373 Union St Unit 3C
- 4373 Union St Unit 3A
- 4373 Union St Unit 2D
- 4373 Union St Unit 2C