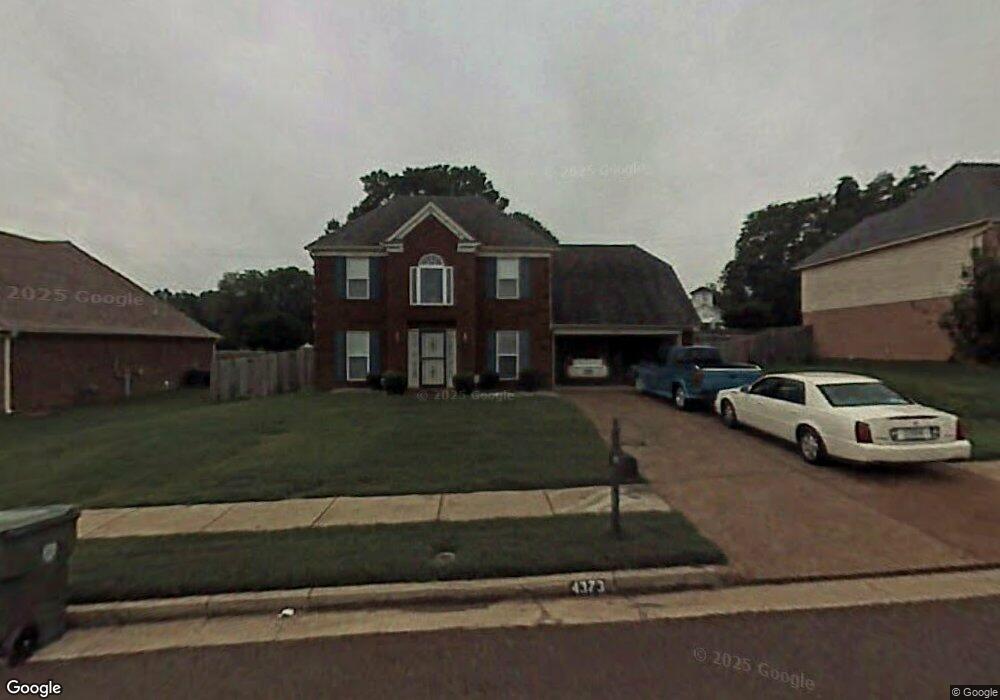
4373 Zachary St Millington, TN 38053
Estimated Value: $244,898 - $270,000
4
Beds
3
Baths
1,901
Sq Ft
$136/Sq Ft
Est. Value
About This Home
This home is located at 4373 Zachary St, Millington, TN 38053 and is currently estimated at $258,475, approximately $135 per square foot. 4373 Zachary St is a home located in Shelby County with nearby schools including Millington Elementary School, Millington High School, and Woodlawn Baptist Academy.
Ownership History
Date
Name
Owned For
Owner Type
Purchase Details
Closed on
Aug 18, 2010
Sold by
Gp Investor Nation
Bought by
Lee Kevin
Current Estimated Value
Home Financials for this Owner
Home Financials are based on the most recent Mortgage that was taken out on this home.
Original Mortgage
$115,500
Interest Rate
4.61%
Mortgage Type
Unknown
Purchase Details
Closed on
Jul 21, 2010
Sold by
Bank Of America Na
Bought by
Gp Investor Nation
Home Financials for this Owner
Home Financials are based on the most recent Mortgage that was taken out on this home.
Original Mortgage
$115,500
Interest Rate
4.61%
Mortgage Type
Unknown
Purchase Details
Closed on
Mar 30, 2010
Sold by
Nash Laquisa E and Nash James W
Bought by
Bank Of America Na
Purchase Details
Closed on
Apr 4, 2005
Sold by
Hendren Scott and Hendren Holly
Bought by
Nash Laquis A
Home Financials for this Owner
Home Financials are based on the most recent Mortgage that was taken out on this home.
Original Mortgage
$158,900
Interest Rate
7.87%
Mortgage Type
Fannie Mae Freddie Mac
Purchase Details
Closed on
Mar 2, 2000
Sold by
Bryant Builders Of Tennessee Llc
Bought by
Hendren Scott and Hendren Holly
Home Financials for this Owner
Home Financials are based on the most recent Mortgage that was taken out on this home.
Original Mortgage
$128,150
Interest Rate
8.29%
Create a Home Valuation Report for This Property
The Home Valuation Report is an in-depth analysis detailing your home's value as well as a comparison with similar homes in the area
Home Values in the Area
Average Home Value in this Area
Purchase History
| Date | Buyer | Sale Price | Title Company |
|---|---|---|---|
| Lee Kevin | $93,900 | West Tennessee Title | |
| Gp Investor Nation | $80,000 | Multiple | |
| Bank Of America Na | $102,600 | None Available | |
| Nash Laquis A | $158,900 | -- | |
| Hendren Scott | $134,900 | -- |
Source: Public Records
Mortgage History
| Date | Status | Borrower | Loan Amount |
|---|---|---|---|
| Closed | Lee Kevin | $115,500 | |
| Previous Owner | Nash Laquis A | $158,900 | |
| Previous Owner | Hendren Scott | $128,150 |
Source: Public Records
Tax History Compared to Growth
Tax History
| Year | Tax Paid | Tax Assessment Tax Assessment Total Assessment is a certain percentage of the fair market value that is determined by local assessors to be the total taxable value of land and additions on the property. | Land | Improvement |
|---|---|---|---|---|
| 2025 | $1,365 | $62,675 | $8,500 | $54,175 |
| 2024 | $3,305 | $48,750 | $7,650 | $41,100 |
| 2023 | $2,335 | $48,750 | $7,650 | $41,100 |
| 2022 | $2,335 | $48,750 | $7,650 | $41,100 |
| 2021 | $2,364 | $48,750 | $7,650 | $41,100 |
| 2020 | $1,964 | $35,200 | $7,650 | $27,550 |
| 2019 | $1,426 | $35,200 | $7,650 | $27,550 |
| 2018 | $1,964 | $35,200 | $7,650 | $27,550 |
| 2017 | $1,985 | $35,200 | $7,650 | $27,550 |
| 2016 | $1,957 | $33,175 | $0 | $0 |
| 2014 | $1,450 | $33,175 | $0 | $0 |
Source: Public Records
Map
Nearby Homes
- 4469 Queen Sinclair Cir
- 6866 Basun Cir E
- 4537 Kings Station Rd
- 4578 Basun Cir E
- 4235 Sykes Rd
- 4140 Pleasant Ridge Rd
- 4600 Goldsby Place
- 4527 Basun Cir S
- 4531 Basun Cir S
- 4537 Basun Cir S
- 4578 Basun Cir N
- 5975 Prairie Cove
- 4703 Cedar Rose Dr
- 4551 Waverly Farms Rd
- 7266 Raleigh Millington Rd
- 3945 Crenshaw Rd
- 4288 Peach Run Lane Ln
- 3545 Lucy Rd
- 4302 Peach Run Lane Ln
- 4315 Peach Run Lane Ln
- 4367 Zachary St
- 4381 Zachary St
- 4374 Zachary St
- 4359 Zachary St
- 4385 Zachary St
- 4368 Zachary St
- 6510 Angie St
- 4362 Zachary St
- 4351 Zachary St
- 4395 Zachary St
- 6519 Angie St
- 4354 Zachary St
- 6518 Angie St
- 4365 Eckois Cove
- 6517 Annielee St
- 4343 Zachary St
- 4357 Eckois Cove
- 4348 Zachary St
- 6528 Angie St
- 6525 Annielee St