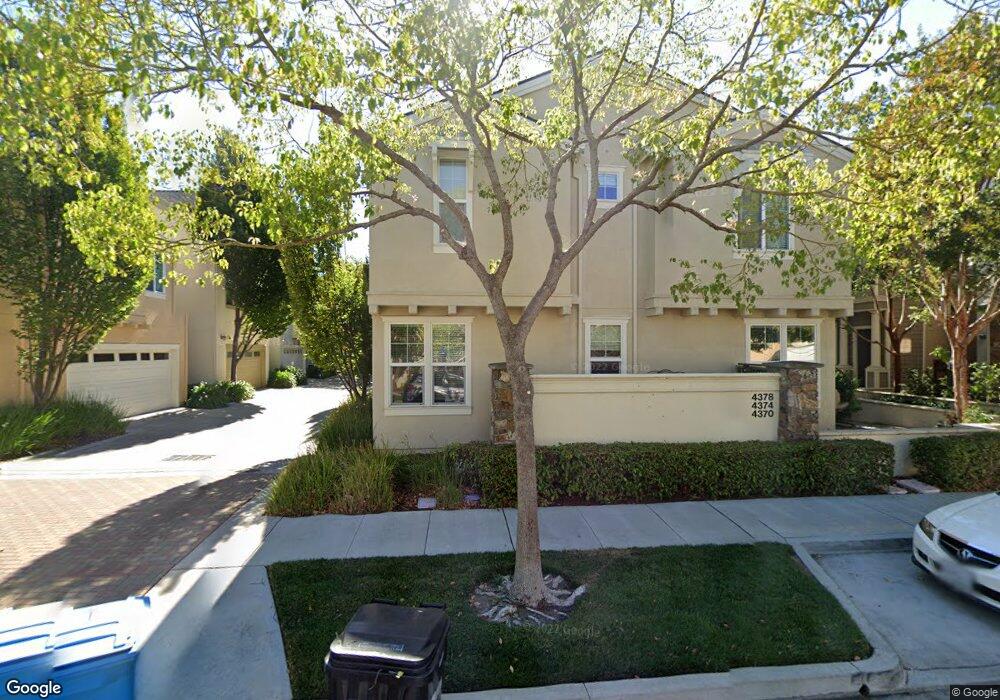
4374 Watson Cir Santa Clara, CA 95054
North Santa Clara NeighborhoodEstimated Value: $1,709,907 - $1,913,000
3
Beds
4
Baths
1,657
Sq Ft
$1,107/Sq Ft
Est. Value
About This Home
This home is located at 4374 Watson Cir, Santa Clara, CA 95054 and is currently estimated at $1,833,477, approximately $1,106 per square foot. 4374 Watson Cir is a home located in Santa Clara County with nearby schools including Don Callejon School, Santa Clara High School, and North Valley Baptist School.
Ownership History
Date
Name
Owned For
Owner Type
Purchase Details
Closed on
Apr 13, 2015
Sold by
Chu Philip Yan Jy and Chu Daywen Yang
Bought by
The Chu 2015 Revocable Trust and Chu Daywen Y
Current Estimated Value
Purchase Details
Closed on
Jun 18, 2007
Sold by
Pokkuluri Venkat S and Pokkuluri Madhavi
Bought by
Chu Philip Yan Jy and Chu Daywen Yang
Purchase Details
Closed on
Oct 15, 2004
Sold by
Greystone Homes Inc
Bought by
Pokkuluri Venkat S and Pokkuluri Madhavi
Home Financials for this Owner
Home Financials are based on the most recent Mortgage that was taken out on this home.
Original Mortgage
$558,350
Interest Rate
5.25%
Mortgage Type
Purchase Money Mortgage
Purchase Details
Closed on
Sep 17, 2003
Sold by
Lennar Homes Of California Inc
Bought by
Greystone Homes Inc
Create a Home Valuation Report for This Property
The Home Valuation Report is an in-depth analysis detailing your home's value as well as a comparison with similar homes in the area
Home Values in the Area
Average Home Value in this Area
Purchase History
| Date | Buyer | Sale Price | Title Company |
|---|---|---|---|
| The Chu 2015 Revocable Trust | -- | None Available | |
| Chu Philip Yan Jy | $865,000 | Alliance Title Company | |
| Pokkuluri Venkat S | $706,500 | North American Title Company | |
| Greystone Homes Inc | -- | -- |
Source: Public Records
Mortgage History
| Date | Status | Borrower | Loan Amount |
|---|---|---|---|
| Previous Owner | Pokkuluri Venkat S | $558,350 | |
| Closed | Pokkuluri Venkat S | $69,700 |
Source: Public Records
Tax History
| Year | Tax Paid | Tax Assessment Tax Assessment Total Assessment is a certain percentage of the fair market value that is determined by local assessors to be the total taxable value of land and additions on the property. | Land | Improvement |
|---|---|---|---|---|
| 2025 | $13,257 | $1,158,902 | $695,341 | $463,561 |
| 2024 | $13,257 | $1,136,179 | $681,707 | $454,472 |
| 2023 | $13,123 | $1,113,902 | $668,341 | $445,561 |
| 2022 | $12,908 | $1,092,062 | $655,237 | $436,825 |
| 2021 | $12,857 | $1,070,650 | $642,390 | $428,260 |
| 2020 | $12,622 | $1,059,673 | $635,804 | $423,869 |
| 2019 | $12,605 | $1,038,896 | $623,338 | $415,558 |
| 2018 | $11,793 | $1,018,526 | $611,116 | $407,410 |
| 2017 | $11,734 | $998,556 | $599,134 | $399,422 |
| 2016 | $11,466 | $978,978 | $587,387 | $391,591 |
| 2015 | $11,437 | $964,273 | $578,564 | $385,709 |
| 2014 | $10,218 | $882,000 | $529,200 | $352,800 |
Source: Public Records
Map
Nearby Homes
- 4424 Lick Mill Blvd
- 979 Garrity Way
- 4346 Headen Way
- 3901 Lick Mill Blvd Unit 430
- 3901 Lick Mill Blvd Unit 116
- 1701 Shore Place Unit 5
- 1933 Silva Place
- 1883 Agnew Rd Unit 311
- 1952 Eisenhower Dr
- 703 Laurie Ave
- 3736 Eastwood Cir
- 4692 Wilcox Ave
- 2214 Gianera St
- 237 El Bosque St
- 2252 Creek Bed Ct
- 2200 Agnew Rd Unit 318
- 2200 Agnew Rd Unit 210
- 304 Los Encinos St Unit 304
- 297 Montague Expy
- 323 Montague Expy
- 4378 Watson Cir
- 4370 Watson Cir
- 4360 Watson Cir
- 4386 Watson Cir
- 4382 Watson Cir
- 4356 Watson Cir
- 4364 Watson Cir
- 4390 Watson Cir
- 4424 Watson Cir
- 4428 Watson Cir
- 4348 Watson Cir
- 4352 Watson Cir
- 4381 Watson Cir
- 4361 Watson Cir
- 4420 Watson Cir
- 4344 Watson Cir
- 4364 Burdick Ln
- 4356 Burdick Ln
- 4374 Burdick Ln
- 4357 Watson Cir
Your Personal Tour Guide
Ask me questions while you tour the home.