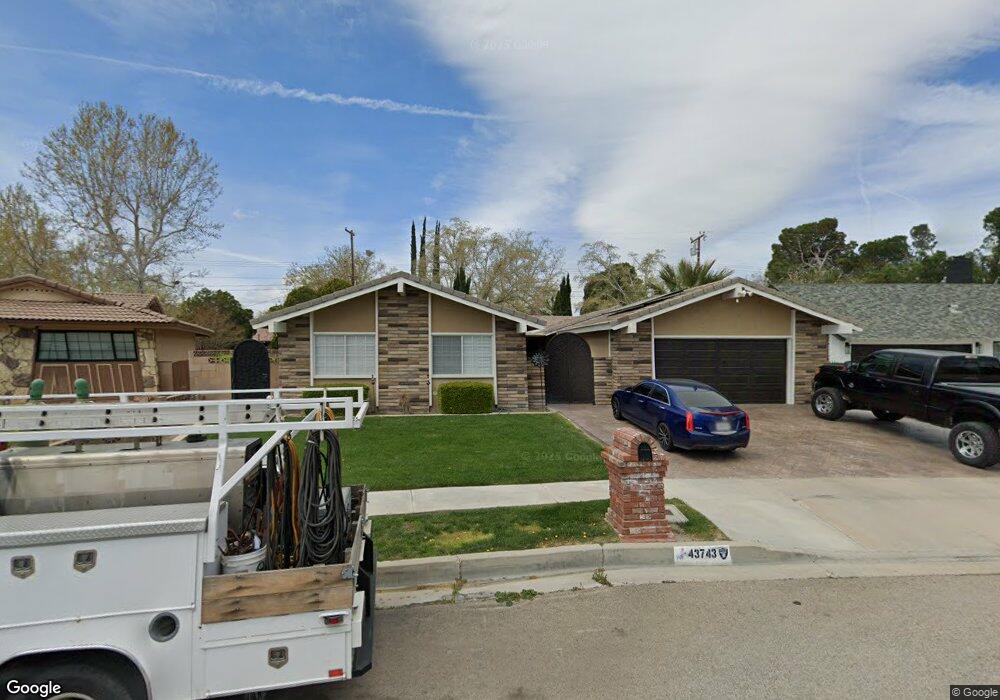
43743 Albeck Ave Lancaster, CA 93536
West Lancaster NeighborhoodEstimated Value: $524,000 - $617,000
5
Beds
3
Baths
2,456
Sq Ft
$230/Sq Ft
Est. Value
About This Home
This home is located at 43743 Albeck Ave, Lancaster, CA 93536 and is currently estimated at $564,820, approximately $229 per square foot. 43743 Albeck Ave is a home located in Los Angeles County with nearby schools including Sunnydale Elementary School, Amargosa Creek Middle School, and Lancaster High School.
Ownership History
Date
Name
Owned For
Owner Type
Purchase Details
Closed on
Oct 9, 1996
Sold by
Thompson James L and Thompson Marline A
Bought by
Thompson James L and Thompson Marline
Current Estimated Value
Home Financials for this Owner
Home Financials are based on the most recent Mortgage that was taken out on this home.
Original Mortgage
$124,645
Outstanding Balance
$11,262
Interest Rate
7.91%
Mortgage Type
FHA
Estimated Equity
$553,558
Purchase Details
Closed on
May 15, 1995
Sold by
Eggstrom Betty Schultz and Schultz Betty Jean
Bought by
Thompson James L and Duronslet Marline
Home Financials for this Owner
Home Financials are based on the most recent Mortgage that was taken out on this home.
Original Mortgage
$125,894
Interest Rate
7.9%
Mortgage Type
FHA
Purchase Details
Closed on
Mar 2, 1994
Sold by
Antelope Valley Trust Deed Services Inc
Bought by
Eggstrom Betty Schultz
Create a Home Valuation Report for This Property
The Home Valuation Report is an in-depth analysis detailing your home's value as well as a comparison with similar homes in the area
Home Values in the Area
Average Home Value in this Area
Purchase History
| Date | Buyer | Sale Price | Title Company |
|---|---|---|---|
| Thompson James L | -- | Old Republic Title Company | |
| Thompson James L | $127,000 | Fidelity National Title Ins | |
| Eggstrom Betty Schultz | -- | -- | |
| Eggstrom Betty Schultz | $140,942 | Chicago Title |
Source: Public Records
Mortgage History
| Date | Status | Borrower | Loan Amount |
|---|---|---|---|
| Open | Thompson James L | $124,645 | |
| Previous Owner | Thompson James L | $125,894 |
Source: Public Records
Tax History
| Year | Tax Paid | Tax Assessment Tax Assessment Total Assessment is a certain percentage of the fair market value that is determined by local assessors to be the total taxable value of land and additions on the property. | Land | Improvement |
|---|---|---|---|---|
| 2025 | $4,693 | $275,019 | $42,180 | $232,839 |
| 2024 | $4,693 | $269,627 | $41,353 | $228,274 |
| 2023 | $4,595 | $264,342 | $40,543 | $223,799 |
| 2022 | $4,380 | $259,160 | $39,749 | $219,411 |
| 2021 | $3,971 | $254,079 | $38,970 | $215,109 |
| 2019 | $3,856 | $246,545 | $37,815 | $208,730 |
| 2018 | $3,787 | $241,712 | $37,074 | $204,638 |
| 2016 | $3,576 | $232,329 | $35,636 | $196,693 |
| 2015 | $3,530 | $228,840 | $35,101 | $193,739 |
| 2014 | $3,499 | $224,358 | $34,414 | $189,944 |
Source: Public Records
Map
Nearby Homes
- 43717 Albeck Ave
- 105 W Avenue K
- 7200 W Avenue K
- 72xx W Avenue K
- 0 70TH W Avenue K
- 2554 W Avenue j14
- 43860 Fenner Ave
- 2128 Edam St
- 43638 21st St W
- 2040 W Avenue j13
- 2040 W Avenue j13 Unit 19
- 43954 Blue Sky Ct
- 43759 27th St W
- 43846 Johns Ct
- 0 W Avenue K-4 Unit SR25116674
- 43755 Sentry Ln
- 2104 W Avenue j7
- 44019 22nd St W
- 44021 Fenner Ave
- 43352 Edson Ave
- 43749 Albeck Ave
- 43735 Albeck Ave
- 43740 Lively Ave
- 43730 Lively Ave
- 43750 Lively Ave
- 43757 Albeck Ave
- 43729 Albeck Ave
- 43718 Lively Ave
- 43732 Albeck Ave
- 43748 Albeck Ave
- 43756 Albeck Ave
- 43760 Lively Ave
- 43708 Lively Ave
- 43723 Albeck Ave
- 43765 Albeck Ave
- 43741 Lively Ave
- 43733 Lively Ave
- 43713 22nd St W
- 43721 22nd St W
- 43764 Albeck Ave
Your Personal Tour Guide
Ask me questions while you tour the home.