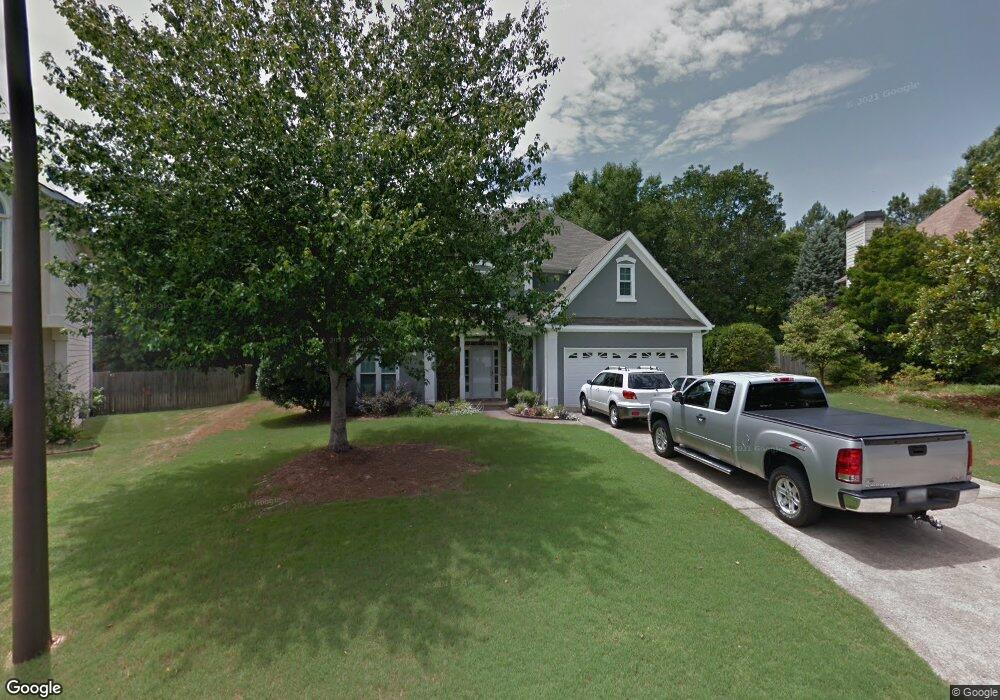
4375 Laughlin Ct NW Kennesaw, GA 30144
Estimated Value: $457,333 - $504,000
3
Beds
3
Baths
2,613
Sq Ft
$184/Sq Ft
Est. Value
About This Home
This home is located at 4375 Laughlin Ct NW, Kennesaw, GA 30144 and is currently estimated at $479,833, approximately $183 per square foot. 4375 Laughlin Ct NW is a home located in Cobb County with nearby schools including Pitner Elementary School, Palmer Middle School, and Shiloh Hills Christian School.
Ownership History
Date
Name
Owned For
Owner Type
Purchase Details
Closed on
Feb 27, 2025
Sold by
Friday Jeffery E and Friday Patricia A
Bought by
Jeffery And Patricia Friday Revocable Trust and Friday
Current Estimated Value
Purchase Details
Closed on
Jun 3, 2008
Sold by
Friday Jeffery E
Bought by
Friday Jeffery E and Friday Patricia A
Home Financials for this Owner
Home Financials are based on the most recent Mortgage that was taken out on this home.
Original Mortgage
$222,095
Interest Rate
6.02%
Mortgage Type
VA
Purchase Details
Closed on
Apr 17, 2003
Sold by
Moody John W
Bought by
Moody John W and Moody Eva W
Purchase Details
Closed on
May 3, 1993
Sold by
Cherokee Southern Drywall Supply Inc
Bought by
Moody John W
Home Financials for this Owner
Home Financials are based on the most recent Mortgage that was taken out on this home.
Original Mortgage
$126,562
Interest Rate
7.5%
Mortgage Type
VA
Create a Home Valuation Report for This Property
The Home Valuation Report is an in-depth analysis detailing your home's value as well as a comparison with similar homes in the area
Home Values in the Area
Average Home Value in this Area
Purchase History
| Date | Buyer | Sale Price | Title Company |
|---|---|---|---|
| Jeffery And Patricia Friday Revocable Trust | -- | None Listed On Document | |
| Friday Jeffery E | -- | -- | |
| Friday Jeffery E | $215,000 | -- | |
| Moody John W | -- | -- | |
| Moody John W | $125,000 | -- |
Source: Public Records
Mortgage History
| Date | Status | Borrower | Loan Amount |
|---|---|---|---|
| Previous Owner | Friday Jeffery E | $222,095 | |
| Previous Owner | Moody John W | $126,562 |
Source: Public Records
Tax History Compared to Growth
Tax History
| Year | Tax Paid | Tax Assessment Tax Assessment Total Assessment is a certain percentage of the fair market value that is determined by local assessors to be the total taxable value of land and additions on the property. | Land | Improvement |
|---|---|---|---|---|
| 2025 | $1,045 | $162,948 | $40,000 | $122,948 |
| 2024 | $1,048 | $162,948 | $40,000 | $122,948 |
| 2023 | $842 | $162,948 | $40,000 | $122,948 |
| 2022 | $863 | $100,964 | $22,000 | $78,964 |
| 2021 | $2,582 | $100,964 | $22,000 | $78,964 |
| 2020 | $2,582 | $100,964 | $22,000 | $78,964 |
| 2019 | $2,334 | $89,640 | $18,000 | $71,640 |
| 2018 | $2,334 | $89,640 | $18,000 | $71,640 |
| 2017 | $1,984 | $78,456 | $18,000 | $60,456 |
| 2016 | $1,986 | $78,456 | $18,000 | $60,456 |
| 2015 | $2,016 | $77,564 | $18,000 | $59,564 |
| 2014 | $1,567 | $61,576 | $0 | $0 |
Source: Public Records
Map
Nearby Homes
- 1393 Halpern Ln NW
- 4414 Declan Dr NW
- 1172 Rockmart Cir NW
- 3981 Bear Ridge Place NW
- 4646 Adams Ln NW
- 459 Current Ct NE
- 4223 Glenlake Pkwy NW
- 4342 White Surrey Dr NW
- 1281 Parkwood Chase NW
- 1726 Hickory Grove Way NW
- 1159 Midland Dr NW
- 1276 Westover Trace NW
- Killarney Plan at Hickory Heights
- Kinsale Plan at Hickory Heights
- Ardmore Plan at Hickory Heights
- 4805 Oxford Walk NW
- 1036 Wooten Lake Rd NW
- 1712 Hickory Heights (Lot 1) Way
- 4700 Cromwell Ct NW
- 4379 Laughlin Ct NW
- 4371 Laughlin Ct NW
- 4383 Laughlin Ct NW
- 4380 Laughlin Ct NW
- 4367 Laughlin Ct NW
- 4376 Laughlin Ct NW
- 4387 Laughlin Ct NW
- 4384 Laughlin Ct NW
- 1350 Wooten Lake Rd NW Unit 208
- 1350 Wooten Lake Rd NW Unit 106
- 1350 Wooten Lake Rd NW
- 1350 Wooten Lake Rd NW Unit 207
- 1350 Wooten Lake Rd NW Unit 200209
- 1350 Wooten Lake Rd NW Unit 210
- 1350 Wooten Lake Rd NW Unit 100103
- 1350 Wooten Lake Rd NW Unit 200207
- 4363 Laughlin Ct NW
- 0 Laughlin Ct NW Unit 7316165
- 0 Laughlin Ct NW Unit 8412434
- 0 Laughlin Ct NW Unit 7397762