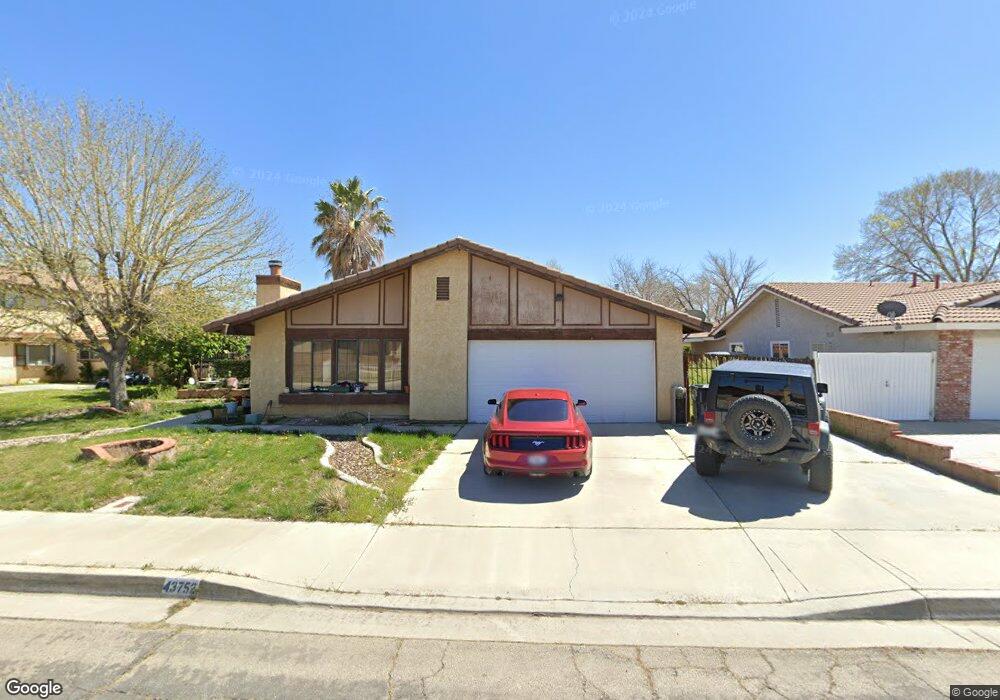
43752 La Paz Ln Lancaster, CA 93535
East Lancaster NeighborhoodEstimated Value: $415,415 - $490,000
3
Beds
2
Baths
1,634
Sq Ft
$273/Sq Ft
Est. Value
About This Home
This home is located at 43752 La Paz Ln, Lancaster, CA 93535 and is currently estimated at $446,354, approximately $273 per square foot. 43752 La Paz Ln is a home located in Los Angeles County with nearby schools including Columbia Elementary School, Gifford C. Cole Middle School, and Eastside High School.
Ownership History
Date
Name
Owned For
Owner Type
Purchase Details
Closed on
Jan 24, 2006
Sold by
Martinez Carrie C
Bought by
Jost Patricia P and Martinez Carrie C
Current Estimated Value
Home Financials for this Owner
Home Financials are based on the most recent Mortgage that was taken out on this home.
Original Mortgage
$101,000
Outstanding Balance
$57,128
Interest Rate
6.28%
Mortgage Type
New Conventional
Estimated Equity
$389,226
Purchase Details
Closed on
Oct 20, 2003
Sold by
Martinez Carrie C
Bought by
Martinez Carrie C and Jost Norbert P
Purchase Details
Closed on
Jul 21, 1998
Sold by
Drushal Richard G and Drushal Patricia A
Bought by
Martinez Carrie C
Home Financials for this Owner
Home Financials are based on the most recent Mortgage that was taken out on this home.
Original Mortgage
$81,738
Interest Rate
6.88%
Mortgage Type
FHA
Create a Home Valuation Report for This Property
The Home Valuation Report is an in-depth analysis detailing your home's value as well as a comparison with similar homes in the area
Home Values in the Area
Average Home Value in this Area
Purchase History
| Date | Buyer | Sale Price | Title Company |
|---|---|---|---|
| Jost Patricia P | -- | First American Title Ins Co | |
| Martinez Carrie C | -- | American Coast Title | |
| Martinez Carrie C | $82,000 | Fidelity National Title Co |
Source: Public Records
Mortgage History
| Date | Status | Borrower | Loan Amount |
|---|---|---|---|
| Open | Jost Patricia P | $101,000 | |
| Closed | Martinez Carrie C | $81,738 |
Source: Public Records
Tax History
| Year | Tax Paid | Tax Assessment Tax Assessment Total Assessment is a certain percentage of the fair market value that is determined by local assessors to be the total taxable value of land and additions on the property. | Land | Improvement |
|---|---|---|---|---|
| 2025 | $2,838 | $128,525 | $25,694 | $102,831 |
| 2024 | $2,838 | $126,006 | $25,191 | $100,815 |
| 2023 | $2,761 | $123,537 | $24,698 | $98,839 |
| 2022 | $2,619 | $121,115 | $24,214 | $96,901 |
| 2021 | $2,260 | $118,741 | $23,740 | $95,001 |
| 2019 | $2,216 | $115,221 | $23,037 | $92,184 |
| 2018 | $2,180 | $112,963 | $22,586 | $90,377 |
| 2016 | $2,083 | $108,578 | $21,710 | $86,868 |
| 2015 | $2,057 | $106,948 | $21,384 | $85,564 |
| 2014 | $2,072 | $104,854 | $20,966 | $83,888 |
Source: Public Records
Map
Nearby Homes
- 43716 La Paz Ln
- 43749 San Francisco Ave
- 43730 San Francisco Ave
- 43752 Tranquility Ct
- 2852 San Ramon Dr
- 43846 Estrella Ln
- 3042 San Luis Dr
- 43846 Tranquility Ct
- 43938 Delgado Ct
- 43823 Tranquility Ct
- 43653 Serenity Ct
- 43824 Serenity Ct
- 3116 Peaceful Way
- 3057 Kilt Ct
- 110 E Avenue J 8
- 100 E Avenue J 8
- 43653 32nd St E
- 43414 Tranquility Ct
- 3116 Kilt Ct
- Vl Apn 3170-007-020
- 43756 La Paz Ln
- 43746 La Paz Ln
- 43737 Bravo Ln
- 43733 Bravo Ln
- 43742 La Paz Ln
- 43764 La Paz Ln
- 2723 La Mesa Ct
- 43749 Bravo Ln
- 43729 Bravo Ln
- 43805 Santa Rosa Cir
- 43732 La Paz Ln
- 2722 La Mesa Ct
- 2717 La Mesa Ct
- 43735 Santa Rosa Cir
- 43815 Santa Rosa Cir
- 43725 Bravo Ln
- 43726 La Paz Ln
- 2716 La Mesa Ct
- 43730 Bravo Ln
- 43737 La Paz Ln
Your Personal Tour Guide
Ask me questions while you tour the home.