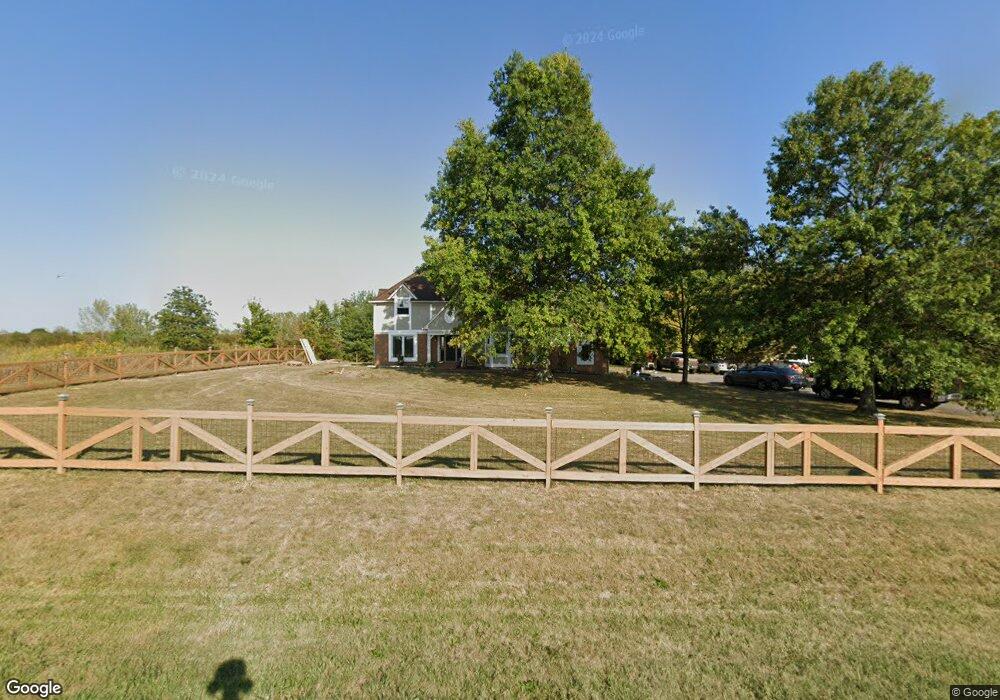
4376 Bowen Rd Canal Winchester, OH 43110
Abbie Trails NeighborhoodEstimated Value: $452,000 - $610,000
4
Beds
3
Baths
2,980
Sq Ft
$184/Sq Ft
Est. Value
About This Home
This home is located at 4376 Bowen Rd, Canal Winchester, OH 43110 and is currently estimated at $547,301, approximately $183 per square foot. 4376 Bowen Rd is a home located in Franklin County with nearby schools including Pickerington Elementary School, Diley Middle School, and Pickerington Ridgeview Junior High School.
Ownership History
Date
Name
Owned For
Owner Type
Purchase Details
Closed on
Aug 7, 2019
Sold by
Tffk Llc
Bought by
Fortune Kara Weiser and Tffk Trust
Current Estimated Value
Purchase Details
Closed on
Dec 27, 2017
Sold by
Phieffer James W and Phieffer Laura S
Bought by
Tffk Llc
Purchase Details
Closed on
Nov 23, 2011
Sold by
Wells Fargo Bank Na
Bought by
Phieffer James W and Phieffer Laura S
Home Financials for this Owner
Home Financials are based on the most recent Mortgage that was taken out on this home.
Original Mortgage
$123,750
Interest Rate
3.89%
Mortgage Type
New Conventional
Purchase Details
Closed on
Sep 20, 2011
Sold by
Kohner Lincoln H and Kohner Carrie R
Bought by
Wells Fargo Bank Na
Purchase Details
Closed on
May 1, 1998
Sold by
Smith Paul D and Smith Christine M
Bought by
Kohner Dr Lincoln H and Kohner Carrie R
Purchase Details
Closed on
Jul 10, 1986
Create a Home Valuation Report for This Property
The Home Valuation Report is an in-depth analysis detailing your home's value as well as a comparison with similar homes in the area
Home Values in the Area
Average Home Value in this Area
Purchase History
| Date | Buyer | Sale Price | Title Company |
|---|---|---|---|
| Fortune Kara Weiser | -- | None Available | |
| Tffk Llc | $311,000 | All Ohio Title Agency Llc | |
| Phieffer James W | $165,000 | Meptitle Land | |
| Wells Fargo Bank Na | $180,000 | Attorney | |
| Kohner Dr Lincoln H | $255,000 | Amerititle Agency Inc | |
| -- | $17,500 | -- |
Source: Public Records
Mortgage History
| Date | Status | Borrower | Loan Amount |
|---|---|---|---|
| Previous Owner | Phieffer James W | $123,750 |
Source: Public Records
Tax History Compared to Growth
Tax History
| Year | Tax Paid | Tax Assessment Tax Assessment Total Assessment is a certain percentage of the fair market value that is determined by local assessors to be the total taxable value of land and additions on the property. | Land | Improvement |
|---|---|---|---|---|
| 2024 | $10,713 | $146,200 | $26,360 | $119,840 |
| 2023 | $6,891 | $146,195 | $26,355 | $119,840 |
| 2022 | $21,453 | $129,960 | $22,120 | $107,840 |
| 2021 | $7,725 | $129,960 | $22,120 | $107,840 |
| 2020 | $7,678 | $129,960 | $22,120 | $107,840 |
| 2019 | $6,901 | $108,300 | $18,450 | $89,850 |
| 2018 | $6,365 | $108,300 | $18,450 | $89,850 |
| 2017 | $6,124 | $108,300 | $18,450 | $89,850 |
| 2016 | $4,722 | $64,760 | $14,110 | $50,650 |
| 2015 | $4,874 | $64,760 | $14,110 | $50,650 |
| 2014 | $4,597 | $64,760 | $14,110 | $50,650 |
| 2013 | $2,290 | $64,750 | $14,105 | $50,645 |
Source: Public Records
Map
Nearby Homes
- 5101 Bowen Rd
- 5135 Upland Meadow Dr
- 7505 Oliver Winchester Dr
- 4028 Boyer Ridge Dr
- 6474 Crab Apple Dr Unit 3
- 6479 Crab Apple Dr Unit 4
- 6865 Manor Crest Ln
- 5222 Algean Dr
- 5106 Novelty Ave Unit 68F
- 5012 Gore St
- 5332 Wadley Ct
- 6409 Nottinghill Trail Dr Unit 26409
- 6395 Nottinghill Trail Dr Unit 1
- 6389 Nottinghill Trail Dr Unit 1
- 5206 Novelty Ave Unit 73C
- 165 Balderson Dr
- 5200 Mantua Dr Unit 63C
- 5195 Mantua Dr Unit 62D
- 6977 Remsen Dr Unit 77D
- Fairton Plan at Brookview
- 7075 Wright Rd
- 4124 Bowen Rd
- 6991 Wright Rd
- 6999 Wright Rd
- 0 Bowen Rd
- 4024 Bowen Rd
- 4000 Bowen Rd
- 5201 Bowen Rd
- 3987 Bowen Rd
- 7476 Tyler Henry Ct
- 7468 Tyler Henry Ct
- 7484 Tyler Henry Ct
- 7460 Tyler Henry Ct
- 7452 Tyler Henry Ct
- 7444 Tyler Henry Ct
- 7436 Tyler Henry Ct
- 5055 Upland Meadow Dr
- 5077 Upland Meadow Dr
- 5083 Upland Meadow Dr
- 3981 Bowen Rd