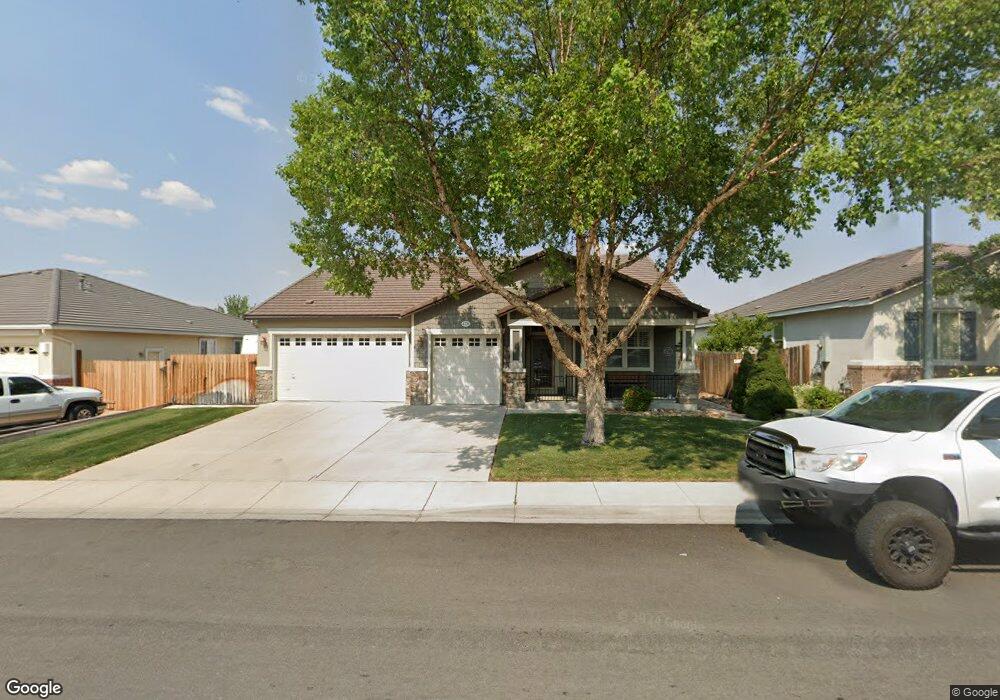
4376 Dancing Moon Way Unit 1 Sparks, NV 89436
Los Altos Parkway NeighborhoodEstimated Value: $624,162 - $730,000
3
Beds
2
Baths
2,070
Sq Ft
$321/Sq Ft
Est. Value
About This Home
This home is located at 4376 Dancing Moon Way Unit 1, Sparks, NV 89436 and is currently estimated at $664,791, approximately $321 per square foot. 4376 Dancing Moon Way Unit 1 is a home located in Washoe County with nearby schools including Bud Beasley Elementary School, Edward C Reed High School, and Excel Christian School.
Ownership History
Date
Name
Owned For
Owner Type
Purchase Details
Closed on
Feb 13, 2015
Sold by
Coulson Stanley Keith and Coulson Stanley Keith
Bought by
Coulson Stanley Keith
Current Estimated Value
Home Financials for this Owner
Home Financials are based on the most recent Mortgage that was taken out on this home.
Original Mortgage
$228,000
Outstanding Balance
$173,984
Interest Rate
3.66%
Mortgage Type
New Conventional
Estimated Equity
$490,807
Purchase Details
Closed on
Nov 14, 2014
Sold by
Coulson Brenda Suszanne
Bought by
Coulson Stanley Keith
Purchase Details
Closed on
Jan 21, 2003
Sold by
Centex Homes
Bought by
Coulson Stanley K and Coulson Brenda S
Home Financials for this Owner
Home Financials are based on the most recent Mortgage that was taken out on this home.
Original Mortgage
$216,700
Interest Rate
5.96%
Create a Home Valuation Report for This Property
The Home Valuation Report is an in-depth analysis detailing your home's value as well as a comparison with similar homes in the area
Home Values in the Area
Average Home Value in this Area
Purchase History
| Date | Buyer | Sale Price | Title Company |
|---|---|---|---|
| Coulson Stanley Keith | -- | Capital Title Co Of Nevada | |
| Coulson Stanley Keith | -- | None Available | |
| Coulson Stanley K | $270,890 | Stewart Title Of Northern Nv |
Source: Public Records
Mortgage History
| Date | Status | Borrower | Loan Amount |
|---|---|---|---|
| Open | Coulson Stanley Keith | $228,000 | |
| Closed | Coulson Stanley K | $216,700 | |
| Closed | Coulson Stanley K | $40,600 |
Source: Public Records
Tax History Compared to Growth
Tax History
| Year | Tax Paid | Tax Assessment Tax Assessment Total Assessment is a certain percentage of the fair market value that is determined by local assessors to be the total taxable value of land and additions on the property. | Land | Improvement |
|---|---|---|---|---|
| 2025 | $3,565 | $167,492 | $58,212 | $109,280 |
| 2024 | $3,565 | $162,701 | $52,577 | $110,124 |
| 2023 | $3,462 | $160,296 | $56,252 | $104,045 |
| 2022 | $3,362 | $134,220 | $47,654 | $86,566 |
| 2021 | $3,264 | $126,543 | $40,651 | $85,892 |
| 2020 | $3,167 | $124,338 | $38,367 | $85,971 |
| 2019 | $3,074 | $120,187 | $37,240 | $82,947 |
| 2018 | $2,985 | $108,770 | $27,636 | $81,134 |
| 2017 | $2,899 | $109,165 | $27,636 | $81,529 |
| 2016 | $2,825 | $109,035 | $27,146 | $81,889 |
| 2015 | $2,821 | $96,441 | $22,197 | $74,244 |
| 2014 | $2,740 | $93,729 | $24,255 | $69,474 |
| 2013 | -- | $70,909 | $18,620 | $52,289 |
Source: Public Records
Map
Nearby Homes
- 4383 Setting Sun Ct Unit 1
- 4601 N Cactus Hills Ct
- 1850 Almonte Ct
- 2411 Tecumseh Way Unit 12
- 2415 Tecumseh Way
- 2427 Tecumseh Way Unit 8
- 2738 Kettle Ct
- 4677 High Pass Ct
- 4393 Acobat Ct
- 1685 Southview Dr
- 4675 Firtree Ln
- 4797 High Pass Dr
- 2316 Isabella Ct
- 2575 Piero Ct
- 3353 Culpepper Dr
- 3375 Culpepper Dr
- 1550 Istrice Rd
- 2631 Michelangelo Ct
- 1560 Freeman Way
- 1557 Satellite Dr
- 4362 Dancing Moon Way
- 4390 Dancing Moon Way
- 4348 Dancing Moon Way
- 4383 Desert Highlands Dr
- 4389 Dancing Moon Way
- 4391 Desert Highlands Dr
- 4334 Dancing Moon Way
- 4361 Dancing Moon Way Unit 1
- 4367 Desert Highlands Dr
- 4410 Dancing Moon Ct Unit 1
- 4375 Desert Highlands Dr
- 4375 Dancing Moon Way Unit 1
- 4395 Dancing Moon Way
- 4359 Desert Highlands Dr
- 4347 Dancing Moon Way Unit 1
- 4415 Desert Highlands Dr
- 4320 Dancing Moon Way Unit 1
- 4405 Dancing Moon Ct
- 4420 Dancing Moon Ct
- 4351 Desert Highlands Dr