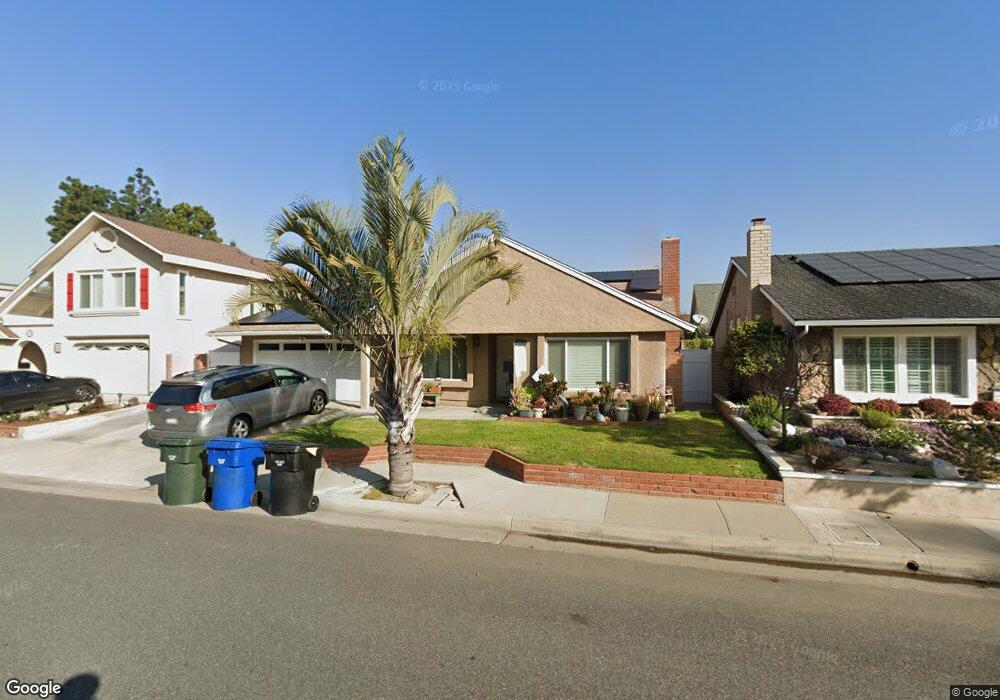
4377 Via Largo Cypress, CA 90630
Estimated Value: $902,000 - $1,260,000
4
Beds
2
Baths
1,988
Sq Ft
$554/Sq Ft
Est. Value
About This Home
This home is located at 4377 Via Largo, Cypress, CA 90630 and is currently estimated at $1,100,800, approximately $553 per square foot. 4377 Via Largo is a home located in Orange County with nearby schools including Margaret Landell Elementary School, A.E. Arnold Elementary School, and Lexington Junior High School.
Ownership History
Date
Name
Owned For
Owner Type
Purchase Details
Closed on
Jul 8, 2009
Sold by
Williams John S
Bought by
Hopkins Shawn and Hopkins Susan
Current Estimated Value
Home Financials for this Owner
Home Financials are based on the most recent Mortgage that was taken out on this home.
Original Mortgage
$285,000
Outstanding Balance
$188,638
Interest Rate
5.59%
Mortgage Type
Purchase Money Mortgage
Estimated Equity
$912,162
Purchase Details
Closed on
Jun 13, 1995
Sold by
Wickers Ina M
Bought by
Wickers Ina M and Wickers Janine N
Purchase Details
Closed on
Jun 6, 1995
Sold by
Wickers Janine N
Bought by
Wickers Janine N and The Janine N Wickers Revocable Living Tr
Create a Home Valuation Report for This Property
The Home Valuation Report is an in-depth analysis detailing your home's value as well as a comparison with similar homes in the area
Home Values in the Area
Average Home Value in this Area
Purchase History
| Date | Buyer | Sale Price | Title Company |
|---|---|---|---|
| Hopkins Shawn | $485,000 | Investors Title Company | |
| Wickers Ina M | -- | -- | |
| Wickers Janine N | -- | -- |
Source: Public Records
Mortgage History
| Date | Status | Borrower | Loan Amount |
|---|---|---|---|
| Open | Hopkins Shawn | $285,000 |
Source: Public Records
Tax History Compared to Growth
Tax History
| Year | Tax Paid | Tax Assessment Tax Assessment Total Assessment is a certain percentage of the fair market value that is determined by local assessors to be the total taxable value of land and additions on the property. | Land | Improvement |
|---|---|---|---|---|
| 2025 | $7,029 | $630,624 | $473,668 | $156,956 |
| 2024 | $7,029 | $618,259 | $464,380 | $153,879 |
| 2023 | $6,868 | $606,137 | $455,275 | $150,862 |
| 2022 | $6,789 | $594,252 | $446,348 | $147,904 |
| 2021 | $6,699 | $582,600 | $437,596 | $145,004 |
| 2020 | $11,128 | $576,627 | $433,109 | $143,518 |
| 2019 | $10,938 | $565,321 | $424,617 | $140,704 |
| 2018 | $10,845 | $554,237 | $416,291 | $137,946 |
| 2017 | $11,215 | $543,370 | $408,128 | $135,242 |
| 2016 | $11,163 | $532,716 | $400,125 | $132,591 |
| 2015 | $6,076 | $524,715 | $394,115 | $130,600 |
| 2014 | $5,751 | $514,437 | $386,395 | $128,042 |
Source: Public Records
Map
Nearby Homes
- 4481 Larwin Ave
- 4177 Elizabeth Ct
- 4418 Larwin Ave
- 4046 Via Encinas
- 4112 Avenida Sevilla
- 10191 Virgil Cir
- 4644 Portofino Cir
- 9686 Bloomfield Ave
- 10126 Bloomfield Ave
- 10144 Bloomfield Ave
- 4671 Myra Ave
- 10202 Aqueduct Dr
- 4068 Avenida Sevilla
- 8381 E Blithedale St
- 4777 Larwin Ave
- 3621 Halbrite Ave
- 10424 Santa Rita St
- 4790 Montefino Dr
- 10455 Santa Marta St
- 4014 Selkirk Ct
- 4367 Via Largo
- 4387 Via Largo
- 4376 Avenida Carmel
- 4366 Avenida Carmel
- 4386 Avenida Carmel
- 4357 Via Largo
- 4397 Via Largo
- 4378 Via Largo
- 4356 Avenida Carmel
- 4368 Via Largo
- 4388 Via Largo
- 4396 Avenida Carmel
- 4358 Via Largo
- 4347 Via Largo
- 4407 Via Largo
- 4398 Via Largo
- 4406 Avenida Carmel
- 4348 Via Largo
- 4346 Avenida Carmel
- 9881 Via Linda