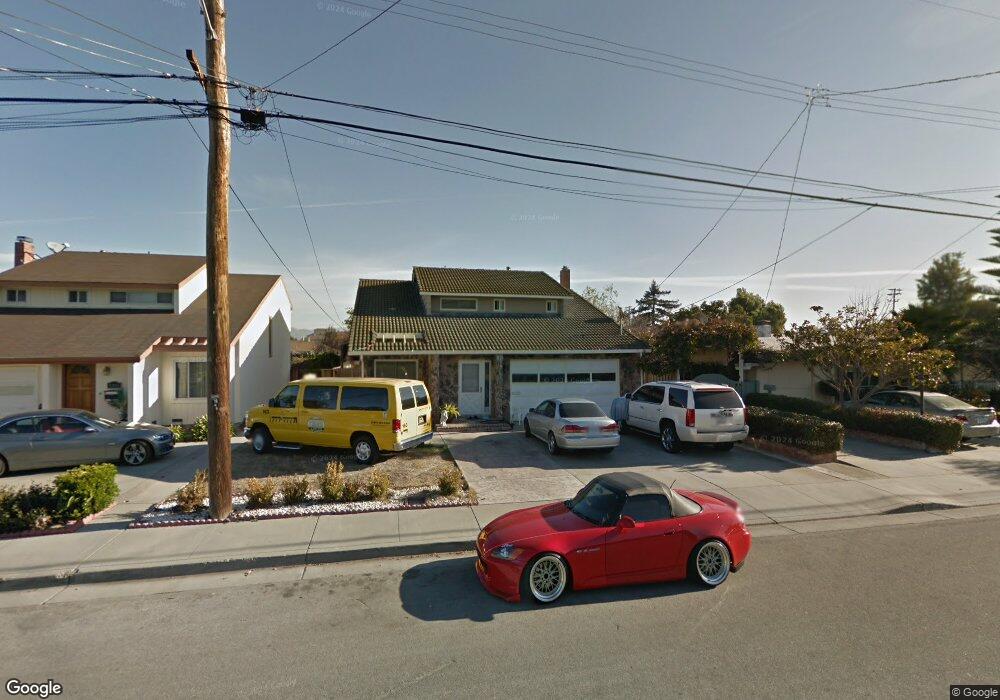
4379 Fillmore St Santa Clara, CA 95054
North Santa Clara NeighborhoodEstimated Value: $1,544,000 - $1,947,000
3
Beds
3
Baths
1,859
Sq Ft
$897/Sq Ft
Est. Value
About This Home
This home is located at 4379 Fillmore St, Santa Clara, CA 95054 and is currently estimated at $1,667,241, approximately $896 per square foot. 4379 Fillmore St is a home located in Santa Clara County with nearby schools including Kathryn Hughes Elementary School, Buchser Middle School, and Santa Clara High School.
Ownership History
Date
Name
Owned For
Owner Type
Purchase Details
Closed on
Oct 7, 2025
Sold by
Singh Harbhajan and Kaur Balbir
Bought by
Harbhajan Singh And Balbir Kaur 2025 Revocabl and Singh
Current Estimated Value
Purchase Details
Closed on
Aug 9, 2010
Sold by
Le Tuyet Ngoc and Tran Nam Thi T
Bought by
Singh Harbhajan and Kaur Balbir
Home Financials for this Owner
Home Financials are based on the most recent Mortgage that was taken out on this home.
Original Mortgage
$287,000
Interest Rate
4.52%
Mortgage Type
New Conventional
Purchase Details
Closed on
Nov 8, 1999
Sold by
Ngoc Le Tuyet and Tran Nam Thi T
Bought by
Le Tuyet Ngoc and Tran Nam Thi T
Home Financials for this Owner
Home Financials are based on the most recent Mortgage that was taken out on this home.
Original Mortgage
$240,000
Interest Rate
7.82%
Purchase Details
Closed on
Mar 10, 1998
Sold by
Le Tuyet N
Bought by
Le Tuyet Ngoc and Tran Nam Thi T
Purchase Details
Closed on
Jan 9, 1995
Sold by
Le Tuyet Ngoc and Le Jennifer Duong
Bought by
Le Tuyet Ngoc
Create a Home Valuation Report for This Property
The Home Valuation Report is an in-depth analysis detailing your home's value as well as a comparison with similar homes in the area
Home Values in the Area
Average Home Value in this Area
Purchase History
| Date | Buyer | Sale Price | Title Company |
|---|---|---|---|
| Harbhajan Singh And Balbir Kaur 2025 Revocabl | -- | None Listed On Document | |
| Singh Harbhajan | $587,000 | Chicago Title Company | |
| Le Tuyet Ngoc | -- | Financial Title Company | |
| Le Tuyet Ngoc | -- | -- | |
| Le Tuyet Ngoc | -- | -- |
Source: Public Records
Mortgage History
| Date | Status | Borrower | Loan Amount |
|---|---|---|---|
| Previous Owner | Singh Harbhajan | $287,000 | |
| Previous Owner | Le Tuyet Ngoc | $240,000 |
Source: Public Records
Tax History Compared to Growth
Tax History
| Year | Tax Paid | Tax Assessment Tax Assessment Total Assessment is a certain percentage of the fair market value that is determined by local assessors to be the total taxable value of land and additions on the property. | Land | Improvement |
|---|---|---|---|---|
| 2025 | $8,707 | $752,037 | $451,223 | $300,814 |
| 2024 | $8,707 | $737,292 | $442,376 | $294,916 |
| 2023 | $8,619 | $722,836 | $433,702 | $289,134 |
| 2022 | $8,476 | $708,664 | $425,199 | $283,465 |
| 2021 | $8,443 | $694,769 | $416,862 | $277,907 |
| 2020 | $8,290 | $687,646 | $412,588 | $275,058 |
| 2019 | $8,279 | $674,164 | $404,499 | $269,665 |
| 2018 | $7,749 | $660,946 | $396,568 | $264,378 |
| 2017 | $7,711 | $647,988 | $388,793 | $259,195 |
| 2016 | $7,560 | $635,283 | $381,170 | $254,113 |
| 2015 | $7,531 | $625,741 | $375,445 | $250,296 |
| 2014 | $7,156 | $613,485 | $368,091 | $245,394 |
Source: Public Records
Map
Nearby Homes
- 2200 Agnew Rd Unit 212
- 2200 Agnew Rd Unit 118
- 4503 Cheeney St
- 1883 Agnew Rd Unit 301
- 1883 Agnew Rd Unit 341
- 1883 Agnew Rd Unit 367
- 1752 Beech St
- 4216 Atlantic Ct
- 1898 Garzoni Place
- 1900 Chestnut St
- 1901 Garzoni Place Unit 405
- 4676 Wilcox Ave
- 4699 Snead Dr
- 2313 Villa Place
- 930 Clyde Ave
- 920 Clyde Ave
- 4464 Laird Cir
- 783 Laurie Ave
- 4012 Fitzpatrick Way Unit 3
- 3901 Lick Mill Blvd Unit 358
- 4381 Fillmore St
- 4345 Fillmore St
- 4385 Fillmore St
- 4335 Fillmore St
- 4354 Cheeney St
- 4344 Cheeney St
- 4374 Cheeney St
- 4395 Fillmore St
- 4325 Fillmore St
- 4334 Cheeney St
- 4356 Fillmore St
- 4384 Cheeney St
- 4346 Fillmore St
- 4376 Fillmore St
- 4336 Fillmore St
- 4390 Fillmore St
- 4324 Cheeney St
- 2128 2nd St
- 4315 Fillmore St
- 4326 Fillmore St