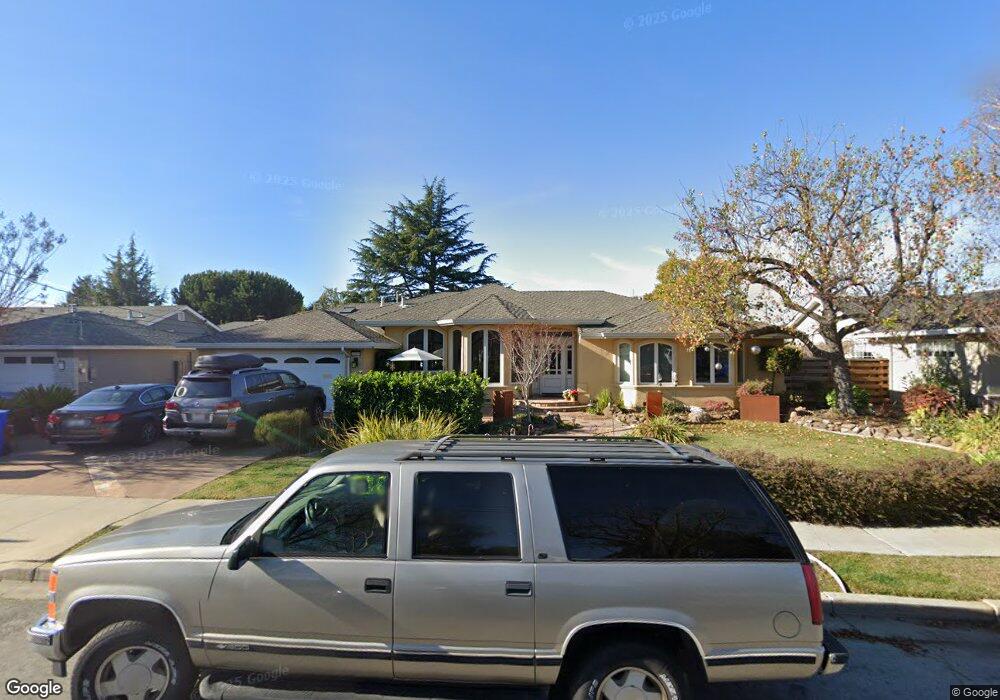
4379 Grover Dr Fremont, CA 94536
Glenmoor NeighborhoodEstimated Value: $1,848,000 - $2,193,999
3
Beds
3
Baths
2,744
Sq Ft
$744/Sq Ft
Est. Value
About This Home
This home is located at 4379 Grover Dr, Fremont, CA 94536 and is currently estimated at $2,042,000, approximately $744 per square foot. 4379 Grover Dr is a home located in Alameda County with nearby schools including Glenmoor Elementary School, Centerville Junior High School, and Washington High School.
Ownership History
Date
Name
Owned For
Owner Type
Purchase Details
Closed on
Jan 21, 2022
Sold by
Walla Craig A and Walla Michele A
Bought by
Walla Family Trust
Current Estimated Value
Purchase Details
Closed on
Oct 18, 2001
Sold by
Walla Craig A and Sayre Michelle A
Bought by
Walla Craig A and Sayre Michelle A
Home Financials for this Owner
Home Financials are based on the most recent Mortgage that was taken out on this home.
Original Mortgage
$275,000
Interest Rate
6.87%
Purchase Details
Closed on
Nov 6, 1996
Sold by
Smith Alfred J and Smith Marilyn R
Bought by
Walla Craig A and Sayre Michelle A
Home Financials for this Owner
Home Financials are based on the most recent Mortgage that was taken out on this home.
Original Mortgage
$298,400
Interest Rate
8.14%
Create a Home Valuation Report for This Property
The Home Valuation Report is an in-depth analysis detailing your home's value as well as a comparison with similar homes in the area
Home Values in the Area
Average Home Value in this Area
Purchase History
| Date | Buyer | Sale Price | Title Company |
|---|---|---|---|
| Walla Family Trust | -- | King And Thompson | |
| Walla Craig A | -- | New Century Title Company | |
| Walla Craig A | $373,000 | Northwestern Title Company |
Source: Public Records
Mortgage History
| Date | Status | Borrower | Loan Amount |
|---|---|---|---|
| Previous Owner | Walla Craig A | $275,000 | |
| Previous Owner | Walla Craig A | $298,400 |
Source: Public Records
Tax History Compared to Growth
Tax History
| Year | Tax Paid | Tax Assessment Tax Assessment Total Assessment is a certain percentage of the fair market value that is determined by local assessors to be the total taxable value of land and additions on the property. | Land | Improvement |
|---|---|---|---|---|
| 2025 | $9,053 | $741,345 | $182,239 | $566,106 |
| 2024 | $9,053 | $726,673 | $178,666 | $555,007 |
| 2023 | $8,807 | $719,291 | $175,163 | $544,128 |
| 2022 | $8,688 | $698,189 | $171,729 | $533,460 |
| 2021 | $8,475 | $684,363 | $168,362 | $523,001 |
| 2020 | $8,486 | $684,278 | $166,637 | $517,641 |
| 2019 | $8,389 | $670,864 | $163,370 | $507,494 |
| 2018 | $8,224 | $657,714 | $160,168 | $497,546 |
| 2017 | $8,018 | $644,821 | $157,028 | $487,793 |
| 2016 | $7,879 | $632,179 | $153,949 | $478,230 |
| 2015 | $7,772 | $622,686 | $151,637 | $471,049 |
| 2014 | $7,637 | $610,491 | $148,668 | $461,823 |
Source: Public Records
Map
Nearby Homes
- 38265 Corrigan Ct
- 4328 Cognina Ct
- 4586 Norris Rd
- 37621 Glenmoor Dr
- 3810 Burton Common
- 4715 Eggers Dr
- 3833 Burton Common
- 4237 Garland Dr
- Plan 1629 at Veranda
- Plan 1165 at Veranda
- Plan 1670 at Veranda
- Plan 1455 at Veranda
- Plan 1394 at Veranda
- Plan 1725 at Veranda
- Plan 1378 at Veranda
- Plan 1657 at Veranda
- 4754 Northdale Dr
- 37721 Madera Ct
- 38030 Dundee Common
- 38324 Blacow Rd