438 18th Ave N South Saint Paul, MN 55075
Estimated Value: $304,000 - $315,000
3
Beds
2
Baths
1,824
Sq Ft
$169/Sq Ft
Est. Value
About This Home
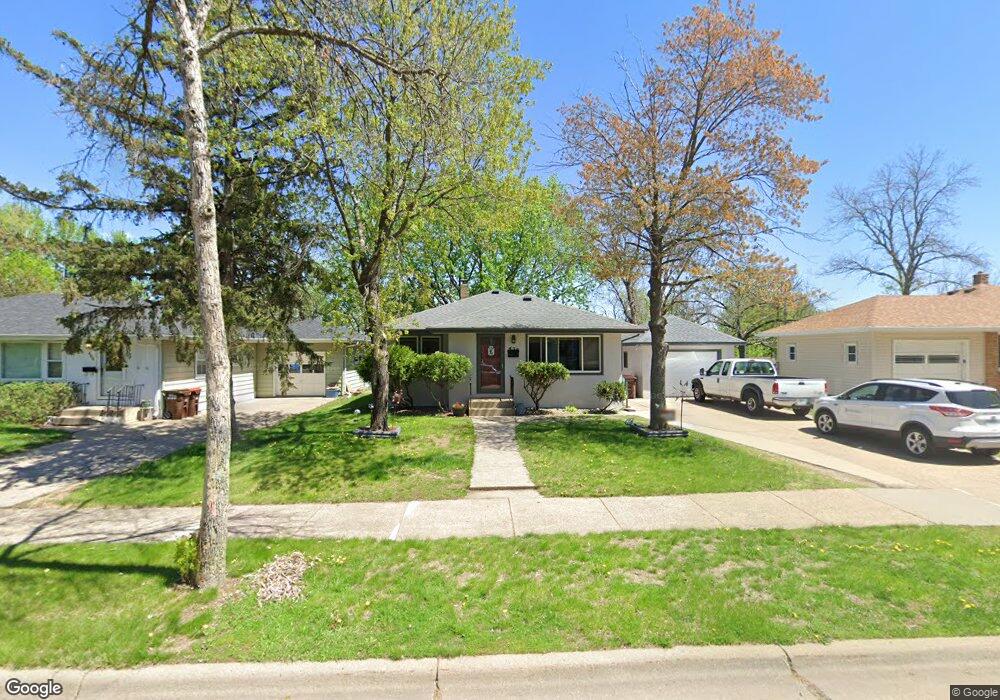
This home is located at 438 18th Ave N, South Saint Paul, MN 55075 and is currently estimated at $308,964, approximately $169 per square foot. 438 18th Ave N is a home located in Dakota County with nearby schools including Lincoln Center Elementary, South St. Paul Secondary, and Academic Arts High School.
Ownership History
Date
Name
Owned For
Owner Type
Purchase Details
Closed on
Jan 30, 2017
Sold by
Perron Mark D
Bought by
Perron Allison N and Matson Allison N
Current Estimated Value
Home Financials for this Owner
Home Financials are based on the most recent Mortgage that was taken out on this home.
Original Mortgage
$119,000
Outstanding Balance
$98,306
Interest Rate
4.12%
Mortgage Type
New Conventional
Estimated Equity
$210,658
Purchase Details
Closed on
Apr 11, 2012
Sold by
Federal Home Loan Mortgage Corporation
Bought by
Perron Mark D and Matson Allison N
Home Financials for this Owner
Home Financials are based on the most recent Mortgage that was taken out on this home.
Original Mortgage
$4,500
Interest Rate
4.08%
Mortgage Type
Unknown
Purchase Details
Closed on
Dec 7, 2011
Sold by
Wells Fargo Bank Na
Bought by
Federal Home Loan Mortgage Corporation
Purchase Details
Closed on
Jul 7, 2004
Sold by
Vega Antonio C and Vega Christina M
Bought by
Pawlenty Bernadette and Bombeck Beth
Create a Home Valuation Report for This Property
The Home Valuation Report is an in-depth analysis detailing your home's value as well as a comparison with similar homes in the area
Home Values in the Area
Average Home Value in this Area
Purchase History
| Date | Buyer | Sale Price | Title Company |
|---|---|---|---|
| Perron Allison N | -- | Stewart Title | |
| Perron Mark D | -- | Stewart Title | |
| Federal Home Loan Mortgage Corporation | -- | None Available | |
| Pawlenty Bernadette | $210,000 | -- |
Source: Public Records
Mortgage History
| Date | Status | Borrower | Loan Amount |
|---|---|---|---|
| Open | Perron Allison N | $119,000 | |
| Closed | Perron Mark D | $4,500 | |
| Closed | Perron Mark D | $119,881 |
Source: Public Records
Tax History Compared to Growth
Tax History
| Year | Tax Paid | Tax Assessment Tax Assessment Total Assessment is a certain percentage of the fair market value that is determined by local assessors to be the total taxable value of land and additions on the property. | Land | Improvement |
|---|---|---|---|---|
| 2024 | $3,332 | $267,700 | $76,300 | $191,400 |
| 2023 | $3,332 | $249,900 | $76,800 | $173,100 |
| 2022 | $2,748 | $251,200 | $76,700 | $174,500 |
| 2021 | $2,708 | $213,200 | $66,700 | $146,500 |
| 2020 | $2,626 | $206,600 | $63,500 | $143,100 |
| 2019 | $2,490 | $205,800 | $60,500 | $145,300 |
| 2018 | $2,374 | $189,100 | $55,000 | $134,100 |
| 2017 | $2,073 | $175,000 | $52,400 | $122,600 |
| 2016 | $2,048 | $159,700 | $47,700 | $112,000 |
| 2015 | $2,009 | $128,876 | $38,392 | $90,484 |
| 2014 | -- | $134,326 | $38,745 | $95,581 |
| 2013 | -- | $117,649 | $33,034 | $84,615 |
Source: Public Records
Map
Nearby Homes
- 436 17th Ave N
- 425 16th Ave N
- 522 16th Ave N
- 2205 Acorn Ln
- 1200 Dwane St
- 606 13th Ave N
- 352 12th Ave N
- 114 20th Ave N
- 601 Levander Way Unit 101
- 601 Levander Way Unit 208
- 127 16th Ave S
- 916 4th St N
- 212 11th Ave N
- 119 22nd Ave S
- 818 16th Ave N
- 152 21st Ave S
- 101 11th Ave N
- 210 19th Ave S
- 119 10th Ave N
- 217 20th Ave S
- 438 438 18th Ave N
- 432 18th Ave N
- 444 444 18th Ave N
- 444 444 18th-Avenue-n
- 432 18th Ave N
- 444 18th Ave N
- 439 439 18th Ave N
- 450 450 18th-Avenue-n
- 450 18th Ave N
- 426 18th Ave N
- 439 17th Ave N
- 445 17th Ave N
- 433 17th Ave N
- 420 18th Ave N
- 451 17th Ave N
- 458 18th Ave N
- 427 17th Ave N
- 439 18th Ave N
- 433 18th Ave N
- 445 18th Ave N