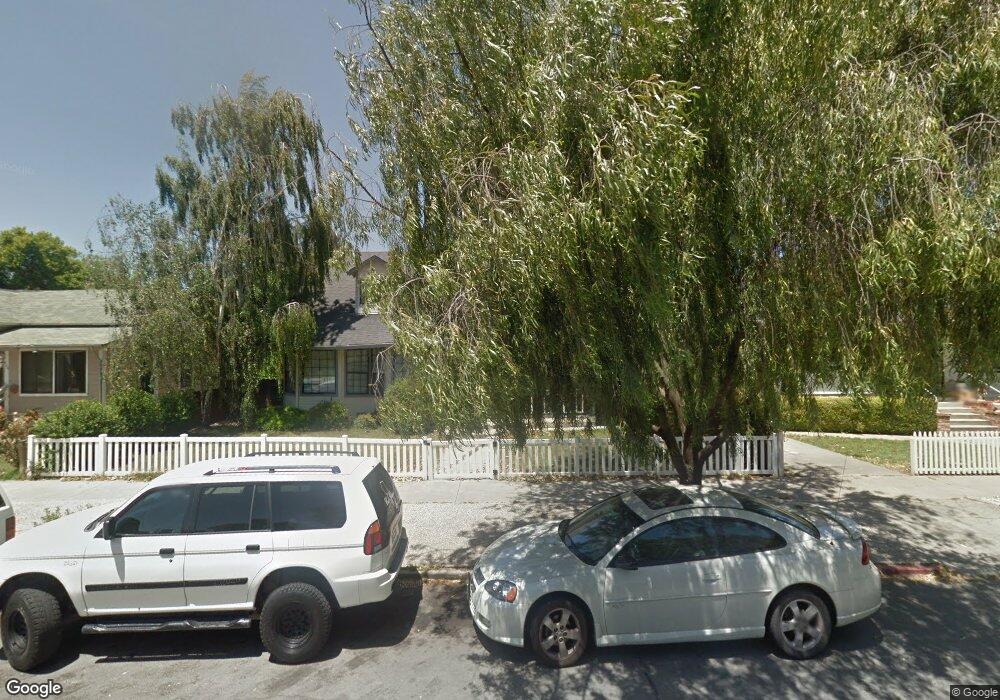
438 7th St Hollister, CA 95023
Estimated Value: $625,000 - $754,000
--
Bed
--
Bath
--
Sq Ft
7,841
Sq Ft Lot
About This Home
This home is located at 438 7th St, Hollister, CA 95023 and is currently estimated at $683,156. 438 7th St is a home located in San Benito County with nearby schools including R. O. Hardin Elementary School, Rancho San Justo School, and San Benito High School.
Ownership History
Date
Name
Owned For
Owner Type
Purchase Details
Closed on
Oct 4, 2000
Sold by
Lebarre Gloria P
Bought by
Oliveira George and Annotti Gina
Current Estimated Value
Home Financials for this Owner
Home Financials are based on the most recent Mortgage that was taken out on this home.
Original Mortgage
$279,200
Interest Rate
9.67%
Purchase Details
Closed on
Mar 26, 1999
Sold by
Gloria Lebarre
Bought by
Lebarre Gloria P
Home Financials for this Owner
Home Financials are based on the most recent Mortgage that was taken out on this home.
Original Mortgage
$90,000
Interest Rate
8.75%
Mortgage Type
Purchase Money Mortgage
Purchase Details
Closed on
Mar 19, 1999
Sold by
Leonard Lebarre
Bought by
Lebarre Gloria
Home Financials for this Owner
Home Financials are based on the most recent Mortgage that was taken out on this home.
Original Mortgage
$90,000
Interest Rate
8.75%
Mortgage Type
Purchase Money Mortgage
Create a Home Valuation Report for This Property
The Home Valuation Report is an in-depth analysis detailing your home's value as well as a comparison with similar homes in the area
Home Values in the Area
Average Home Value in this Area
Purchase History
| Date | Buyer | Sale Price | Title Company |
|---|---|---|---|
| Oliveira George | $349,000 | Fidelity National Title Co | |
| Lebarre Gloria P | -- | Fidelity National Title Co | |
| Lebarre Gloria P | -- | Fidelity National Title Ins | |
| Lebarre Gloria | -- | Fidelity National Title Ins |
Source: Public Records
Mortgage History
| Date | Status | Borrower | Loan Amount |
|---|---|---|---|
| Previous Owner | Oliveira George | $279,200 | |
| Previous Owner | Lebarre Gloria P | $90,000 | |
| Previous Owner | Lebarre Gloria | $90,000 | |
| Closed | Oliveira George | $30,000 |
Source: Public Records
Tax History Compared to Growth
Tax History
| Year | Tax Paid | Tax Assessment Tax Assessment Total Assessment is a certain percentage of the fair market value that is determined by local assessors to be the total taxable value of land and additions on the property. | Land | Improvement |
|---|---|---|---|---|
| 2025 | $6,327 | $525,879 | $188,347 | $337,532 |
| 2023 | $6,327 | $505,460 | $181,034 | $324,426 |
| 2022 | $6,127 | $495,550 | $177,485 | $318,065 |
| 2021 | $6,043 | $485,834 | $174,005 | $311,829 |
| 2020 | $6,069 | $480,853 | $172,221 | $308,632 |
| 2019 | $5,894 | $471,426 | $168,845 | $302,581 |
| 2018 | $5,752 | $462,184 | $165,535 | $296,649 |
| 2017 | $5,675 | $453,123 | $162,290 | $290,833 |
| 2016 | $5,339 | $444,239 | $159,108 | $285,131 |
| 2015 | $5,288 | $437,568 | $156,719 | $280,849 |
| 2014 | $4,392 | $380,000 | $130,000 | $250,000 |
Source: Public Records
Map
Nearby Homes
- 345 6th St
- 375 South St
- 211 6th St
- 400 San Benito St Unit 309
- 400 San Benito St Unit 308
- 400 San Benito St Unit 202
- 400 San Benito St Unit 304
- 400 San Benito St Unit 212
- 400 San Benito St Unit 312
- 435 San Benito St
- 202 5th St
- 895 Monterey St
- 220 4th St
- 713 7th St
- 921 Suiter St
- 190 San Benito St
- 864 Powell St
- 1010 Monterey St
- 805 South St Unit 3
- 805 South St Unit 17