Estimated Value: $133,679 - $167,000
3
Beds
2
Baths
960
Sq Ft
$155/Sq Ft
Est. Value
About This Home
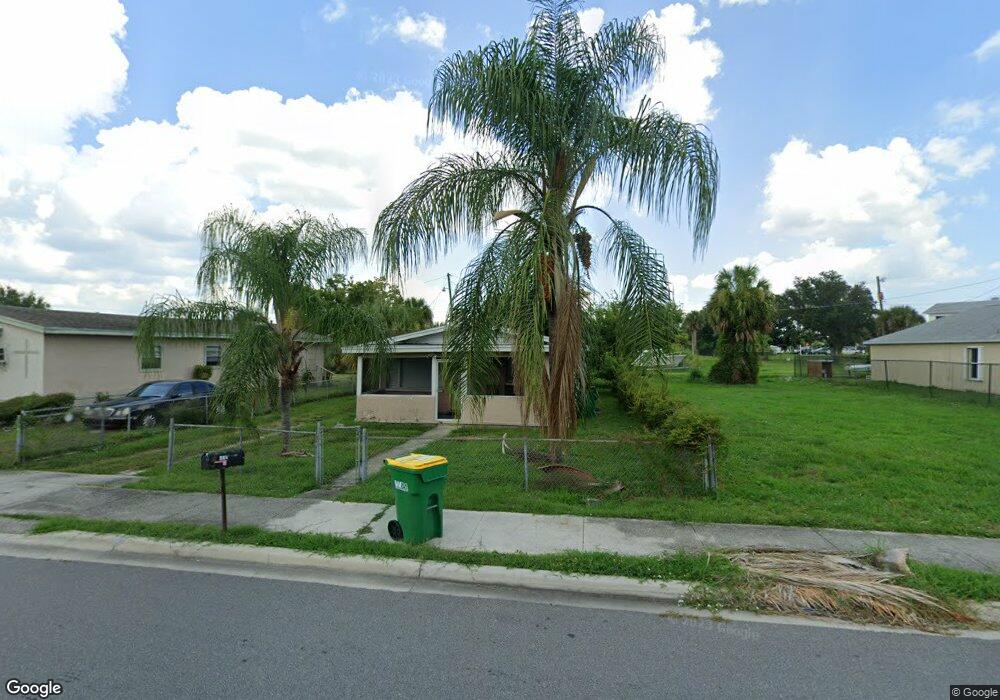
This home is located at 438 Barbara Jenkins St, Cocoa, FL 32922 and is currently estimated at $148,670, approximately $154 per square foot. 438 Barbara Jenkins St is a home located in Brevard County with nearby schools including Endeavour Elementary Magnet, Ronald McNair Magnet Middle School, and Rockledge Senior High School.
Ownership History
Date
Name
Owned For
Owner Type
Purchase Details
Closed on
Mar 11, 2010
Sold by
Moore Yolanda
Bought by
Simmons Arlene
Current Estimated Value
Purchase Details
Closed on
Nov 19, 2009
Sold by
Dawkins Arvedra C
Bought by
Moore Yolanda
Purchase Details
Closed on
Aug 10, 2006
Sold by
Wright Wayne A and Munn Wright Paulet E
Bought by
Dawkins Arvedra C
Home Financials for this Owner
Home Financials are based on the most recent Mortgage that was taken out on this home.
Original Mortgage
$75,750
Interest Rate
6.74%
Purchase Details
Closed on
Dec 31, 2003
Sold by
Palm Beach Investment Group Llc
Bought by
Wright Wayne A and Munn Wright Paulet E
Home Financials for this Owner
Home Financials are based on the most recent Mortgage that was taken out on this home.
Original Mortgage
$42,275
Interest Rate
5.77%
Create a Home Valuation Report for This Property
The Home Valuation Report is an in-depth analysis detailing your home's value as well as a comparison with similar homes in the area
Home Values in the Area
Average Home Value in this Area
Purchase History
| Date | Buyer | Sale Price | Title Company |
|---|---|---|---|
| Simmons Arlene | -- | None Available | |
| Moore Yolanda | $15,000 | Island Title & Escrow Corp | |
| Dawkins Arvedra C | $101,000 | Federal Title Ins Assoc Inc | |
| Wright Wayne A | $44,500 | Alpine Title Company |
Source: Public Records
Mortgage History
| Date | Status | Borrower | Loan Amount |
|---|---|---|---|
| Previous Owner | Dawkins Arvedra C | $75,750 | |
| Previous Owner | Wright Wayne A | $42,275 |
Source: Public Records
Tax History Compared to Growth
Tax History
| Year | Tax Paid | Tax Assessment Tax Assessment Total Assessment is a certain percentage of the fair market value that is determined by local assessors to be the total taxable value of land and additions on the property. | Land | Improvement |
|---|---|---|---|---|
| 2025 | $1,421 | $82,450 | -- | -- |
| 2024 | $1,335 | $84,290 | -- | -- |
| 2023 | $1,335 | $77,530 | $0 | $0 |
| 2022 | $1,134 | $64,370 | $0 | $0 |
| 2021 | $931 | $32,350 | $6,000 | $26,350 |
| 2020 | $875 | $30,040 | $4,000 | $26,040 |
| 2019 | $884 | $30,650 | $4,000 | $26,650 |
| 2018 | $818 | $33,310 | $4,000 | $29,310 |
| 2017 | $761 | $27,820 | $4,000 | $23,820 |
| 2016 | $723 | $25,490 | $4,000 | $21,490 |
| 2015 | $677 | $21,940 | $4,000 | $17,940 |
| 2014 | $611 | $20,870 | $4,000 | $16,870 |
Source: Public Records
Map
Nearby Homes
- 506 Stone St
- 535 Bernard St
- 610 Paw St
- 614 Paw St
- 817 Paw St
- 0000 Lemon St
- 220 Lemon St
- 824 Temple St
- 0 Highway Us 1 Unit 1000884
- Xxxx S Fiske Blvd
- 826 Ferndale Ave
- 919 Fern Ave
- 433 King St
- 535 S Kentucky Ave
- 150 Peachtree St
- 840 Florida Ave Unit 5
- 842 Florida Ave Unit 6
- 305 Prospect Ave
- 1237 Holmes St
- Xxxx Fiske
- 434 Barbara Jenkins St
- 440 Barbara Jenkins St
- 315 Davis St
- 311 Davis St
- 313 Davis St
- 435 Satsuma St
- 437 Satsuma St
- 439 Barbara Jenkins St Unit B
- 439 Barbara Jenkins St
- 504 Barbara Jenkins St
- 316 Loquat St
- 424 Davis St
- 324 Loquat St
- 423 Barbara Jenkins St
- 320 Loquat St
- 312 Loquat St
- 306 Loquat St
- 421 Barbara Jenkins St
- 434 Satsuma St
- 436 Satsuma St