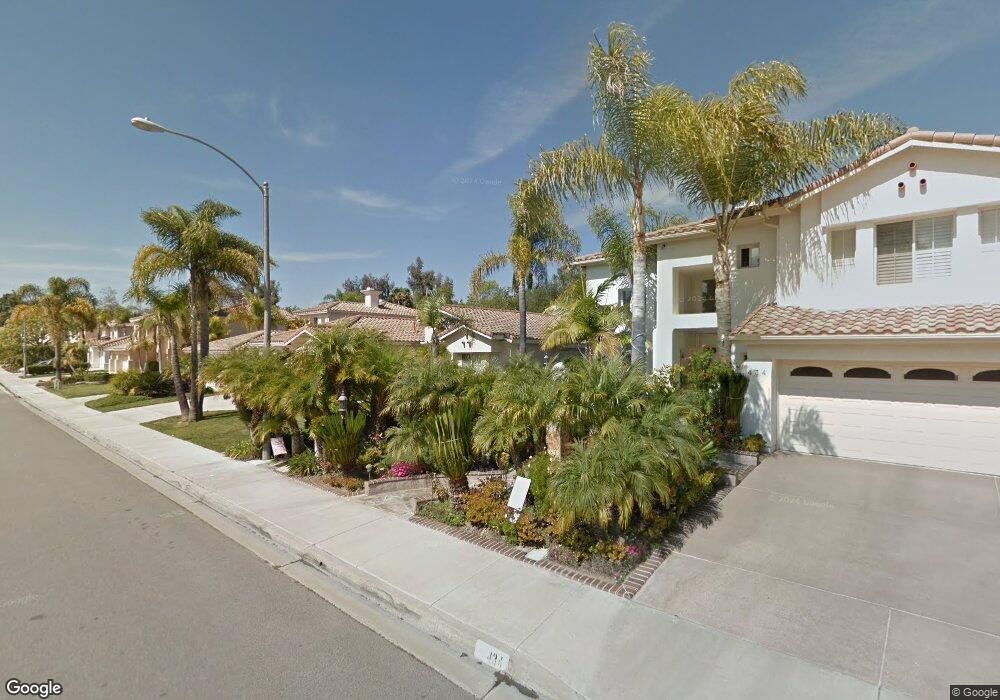
438 Benevente Dr Oceanside, CA 92057
Ivey Ranch-Rancho Del Oro NeighborhoodEstimated Value: $1,132,886 - $1,276,000
4
Beds
3
Baths
2,671
Sq Ft
$455/Sq Ft
Est. Value
About This Home
This home is located at 438 Benevente Dr, Oceanside, CA 92057 and is currently estimated at $1,216,472, approximately $455 per square foot. 438 Benevente Dr is a home located in San Diego County with nearby schools including Ivey Ranch Elementary School, Martin Luther King Jr. Middle School, and El Camino High School.
Ownership History
Date
Name
Owned For
Owner Type
Purchase Details
Closed on
May 29, 2007
Sold by
Intrieri Anthony Peter
Bought by
Intrieri Anthony Peter and Lanigan Rosemarie A
Current Estimated Value
Purchase Details
Closed on
Aug 20, 1999
Sold by
Olympia Intrieri
Bought by
Intrieri Olympia
Purchase Details
Closed on
Apr 8, 1997
Sold by
Nutter Roger B
Bought by
Intrieri Olympia
Purchase Details
Closed on
Sep 5, 1996
Sold by
Nutter Louanne R
Bought by
Nutter Roger B
Purchase Details
Closed on
Sep 17, 1993
Sold by
Udc Universal Development Lp
Bought by
Nutter Roger B and Nutter Louanne R
Home Financials for this Owner
Home Financials are based on the most recent Mortgage that was taken out on this home.
Original Mortgage
$217,750
Interest Rate
7.13%
Mortgage Type
Purchase Money Mortgage
Create a Home Valuation Report for This Property
The Home Valuation Report is an in-depth analysis detailing your home's value as well as a comparison with similar homes in the area
Home Values in the Area
Average Home Value in this Area
Purchase History
| Date | Buyer | Sale Price | Title Company |
|---|---|---|---|
| Intrieri Anthony Peter | -- | None Available | |
| Intrieri Olympia | -- | -- | |
| Intrieri Olympia | -- | -- | |
| Intrieri Olympia | $220,000 | Southland Title | |
| Nutter Roger B | -- | -- | |
| Nutter Roger B | $242,000 | First American Title |
Source: Public Records
Mortgage History
| Date | Status | Borrower | Loan Amount |
|---|---|---|---|
| Previous Owner | Nutter Roger B | $217,750 |
Source: Public Records
Tax History
| Year | Tax Paid | Tax Assessment Tax Assessment Total Assessment is a certain percentage of the fair market value that is determined by local assessors to be the total taxable value of land and additions on the property. | Land | Improvement |
|---|---|---|---|---|
| 2025 | $4,246 | $382,715 | $113,995 | $268,720 |
| 2024 | $4,246 | $375,211 | $111,760 | $263,451 |
| 2023 | $4,116 | $367,855 | $109,569 | $258,286 |
| 2022 | $4,054 | $360,643 | $107,421 | $253,222 |
| 2021 | $4,070 | $353,572 | $105,315 | $248,257 |
| 2020 | $3,944 | $349,948 | $104,236 | $245,712 |
| 2019 | $3,831 | $343,088 | $102,193 | $240,895 |
| 2018 | $3,790 | $336,362 | $100,190 | $236,172 |
| 2017 | $3,721 | $329,768 | $98,226 | $231,542 |
| 2016 | $3,600 | $323,302 | $96,300 | $227,002 |
| 2015 | $3,496 | $318,447 | $94,854 | $223,593 |
| 2014 | $3,361 | $312,210 | $92,996 | $219,214 |
Source: Public Records
Map
Nearby Homes
- 410 De Anza Ct
- 741 Vista Grande Way Unit 313
- 4228 Vista Panorama Way Unit 267
- 392 San Dimas Ave
- 3824 Orange Way
- 4269 Black Duck Way
- 3918 San Lorenzo Ct
- 4002 Craven Rd Unit 4
- 4290 Via Clemente
- 3901 San Lorenzo Ct
- 4382 Dowitcher Way
- 313 San Dimas Ave
- 4307 Star Path Way Unit 1
- 3875 Vista Campana S Unit 32
- 4440 Skimmer Way
- 3888 San Ramon Dr Unit 20
- 101 Avenida Las Brisas
- 4329 Star Path Way Unit 2
- 4321 Star Path Way
- 4336 Harbor Way Unit 1
- 434 Benevente Dr
- 442 Benevente Dr
- 430 Benevente Dr
- 446 Benevente Dr
- 396 Justina Dr
- 437 Benevente Dr
- 403 Lexington Cir
- 426 Benevente Dr
- 450 Benevente Dr
- 433 Benevente Dr
- 401 Lexington Cir
- 405 Lexington Cir
- 407 Lexington Cir
- 429 Benevente Dr
- 390 Justina Dr
- 409 Lexington Cir
- 505 Lexington Cir
- 422 Benevente Dr
- 454 Benevente Dr
- 425 Benevente Dr
Your Personal Tour Guide
Ask me questions while you tour the home.