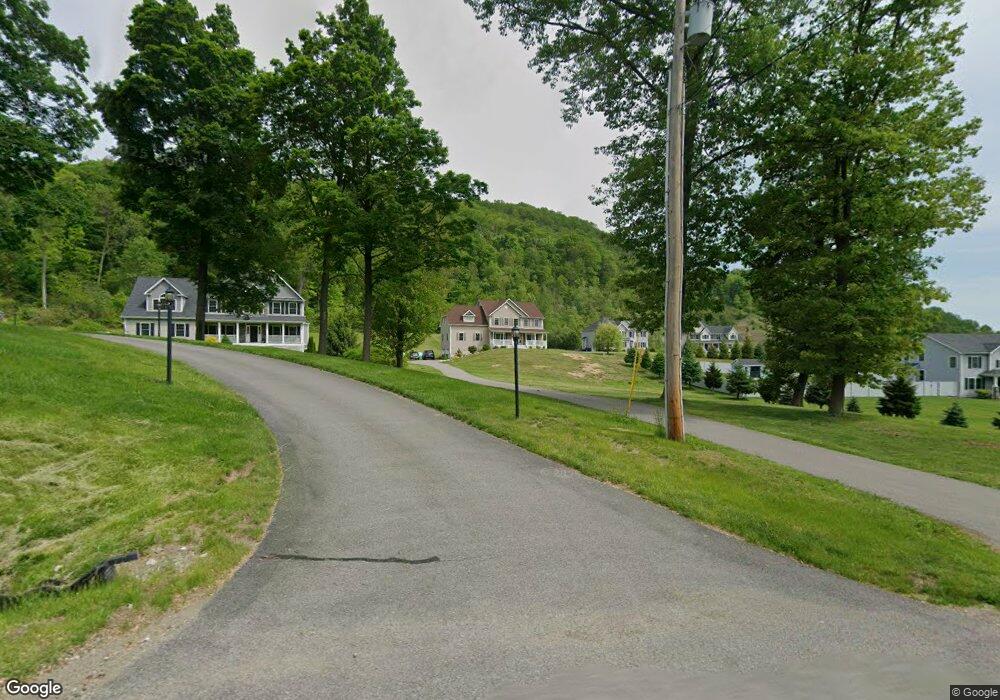
438 Cary Rd Fishkill, NY 12524
Estimated Value: $777,000 - $819,000
About This Home
This home is located at 438 Cary Rd, Fishkill, NY 12524 and is currently estimated at $792,099, approximately $230 per square foot. 438 Cary Rd is a home with nearby schools including Brinckerhoff Elementary School, Van Wyck Junior High School, and John Jay Senior High School.
Ownership History
We collect this data history from publicly available records. To have your information removed, we recommend requesting removal directly through your county’s website.
Purchase Details
Home Financials for this Owner
Home Financials are based on the most recent Mortgage that was taken out on this home.Home Values in the Area
Average Home Value in this Area
Purchase History
We collect this data history from publicly available records. To have your information removed, we recommend requesting removal directly through your county’s website.
| Date | Buyer | Sale Price | Title Company |
|---|---|---|---|
| $490,000 | -- | ||
| -- | -- |
Mortgage History
We collect this data history from publicly available records. To have your information removed, we recommend requesting removal directly through your county’s website.
| Date | Status | Borrower | Loan Amount |
|---|---|---|---|
| Open | $481,124 | ||
| Closed | $481,124 |
Tax History
We collect this data history from publicly available records. To have your information removed, we recommend requesting removal directly through your county’s website.
| Year | Tax Paid | Tax Assessment Tax Assessment Total Assessment is a certain percentage of the fair market value that is determined by local assessors to be the total taxable value of land and additions on the property. | Land | Improvement |
|---|---|---|---|---|
| 2025 | $13,507 | $733,600 | $146,000 | $587,600 |
| 2024 | $13,507 | $685,600 | $132,700 | $552,900 |
| 2023 | $19,384 | $685,600 | $132,700 | $552,900 |
| 2022 | $18,165 | $617,700 | $120,700 | $497,000 |
| 2021 | $16,957 | $561,500 | $107,300 | $454,200 |
| 2020 | $12,600 | $524,700 | $97,100 | $427,600 |
| 2019 | $12,291 | $524,700 | $97,100 | $427,600 |
| 2018 | $12,242 | $511,700 | $97,100 | $414,600 |
| 2017 | $11,780 | $490,000 | $97,100 | $392,900 |
| 2016 | $5,255 | $490,000 | $97,100 | $392,900 |
| 2015 | -- | $97,100 | $97,100 | $0 |
Map
- 272 van Wyck Lake Rd
- 301 van Wyck Lake Rd
- 3515 Bennington Dr
- 3574 Bennington Dr
- 3503 Bennington Dr Unit 74
- 3570 Bennington Dr Unit 1011
- 4010 Chestnut Ridge Rd
- 3418 Bennington Dr
- 4048 Chestnut Ridge Rd
- 811 Huntington Dr
- 801 Huntington Dr
- 1317 Saratoga Ln
- 5102 Teaberry Ln Unit 35
- 5108 Teaberry Ln Unit 32
- 5110 Teaberry Ln Unit 31
- 5114 Teaberry Ln Unit 30
- 5116 Teaberry Ln Unit 29
- 908 Huntington Dr
- 5120 Teaberry Ln Unit 27
- 5106 Teaberry Ln Unit 33
Ask me questions while you tour the home.