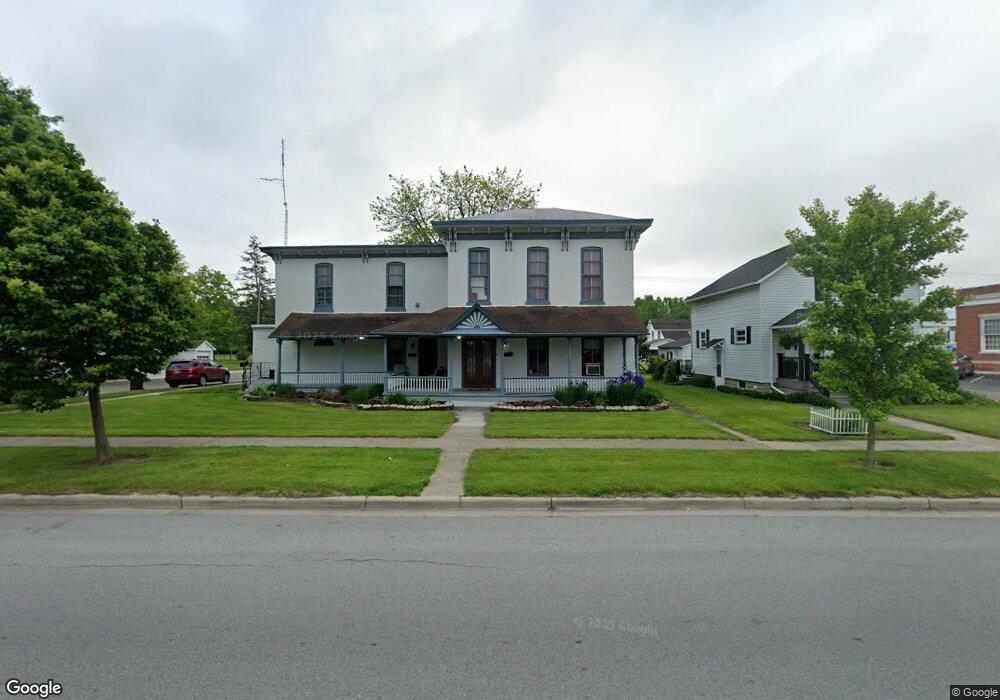
438 E Main St Ottawa, OH 45875
Estimated Value: $135,000 - $168,000
Studio
4
Baths
3,384
Sq Ft
$45/Sq Ft
Est. Value
About This Home
This home is located at 438 E Main St, Ottawa, OH 45875 and is currently estimated at $152,667, approximately $45 per square foot. 438 E Main St is a home located in Putnam County with nearby schools including Ottawa-Glandorf High School and Sts. Peter & Paul Catholic School.
Ownership History
Date
Name
Owned For
Owner Type
Purchase Details
Closed on
Mar 6, 2012
Sold by
Corson Ronald M and Corson Mary M
Bought by
Rmc Investment Property Llc
Current Estimated Value
Purchase Details
Closed on
Mar 10, 2005
Sold by
Maidlow Gerald R and Blankemeyer Anna Mae
Bought by
Corson Ronald M and Corson Mary M
Home Financials for this Owner
Home Financials are based on the most recent Mortgage that was taken out on this home.
Original Mortgage
$81,000
Interest Rate
6.25%
Mortgage Type
Future Advance Clause Open End Mortgage
Purchase Details
Closed on
Jun 12, 2003
Bought by
Rmc Investment Property Llc
Create a Home Valuation Report for This Property
The Home Valuation Report is an in-depth analysis detailing your home's value as well as a comparison with similar homes in the area
Home Values in the Area
Average Home Value in this Area
Purchase History
| Date | Buyer | Sale Price | Title Company |
|---|---|---|---|
| Rmc Investment Property Llc | -- | None Available | |
| Corson Ronald M | $80,200 | None Available | |
| Rmc Investment Property Llc | -- | -- |
Source: Public Records
Mortgage History
| Date | Status | Borrower | Loan Amount |
|---|---|---|---|
| Previous Owner | Corson Ronald M | $81,000 |
Source: Public Records
Tax History
| Year | Tax Paid | Tax Assessment Tax Assessment Total Assessment is a certain percentage of the fair market value that is determined by local assessors to be the total taxable value of land and additions on the property. | Land | Improvement |
|---|---|---|---|---|
| 2025 | $1,741 | $51,270 | $4,810 | $46,460 |
| 2024 | $1,648 | $51,150 | $4,810 | $46,340 |
| 2023 | $1,702 | $36,780 | $3,730 | $33,050 |
| 2022 | $1,389 | $36,782 | $3,731 | $33,051 |
| 2021 | $1,387 | $36,560 | $3,730 | $32,830 |
| 2020 | $1,395 | $32,110 | $3,300 | $28,810 |
| 2019 | $1,252 | $32,690 | $3,730 | $28,960 |
| 2018 | $1,232 | $32,690 | $3,730 | $28,960 |
| 2017 | $1,199 | $32,690 | $3,730 | $28,960 |
| 2016 | $1,199 | $32,110 | $3,300 | $28,810 |
| 2015 | $1,208 | $32,110 | $3,300 | $28,810 |
| 2014 | $1,193 | $32,110 | $3,300 | $28,810 |
| 2013 | $1,189 | $32,110 | $3,300 | $28,810 |
Source: Public Records
Map
Nearby Homes
- 717 E 2nd St
- 740 E Main St
- 370 S Thomas St
- 715 N Perry St
- 717 & 717 1/2 & 721 E Third St
- 238 N Ohio Ave
- 1535 E 3rd St
- 1731 S Agner St
- 0 Sapphire St Unit 225029940
- 0 Sapphire St Unit 225046385
- 1823 S Agner St
- 309 Oakview Dr
- 1997 E Main St
- 113 Crabapple Ln
- 331 Chippewa Dr
- 9896 Road M
- 9410 Road H
- 12806 Road K
- 5666 State Route 224
- 13592 Ohio 694
Your Personal Tour Guide
Ask me questions while you tour the home.