Estimated Value: $285,000 - $688,000
Studio
3
Baths
3,228
Sq Ft
$152/Sq Ft
Est. Value
About This Home
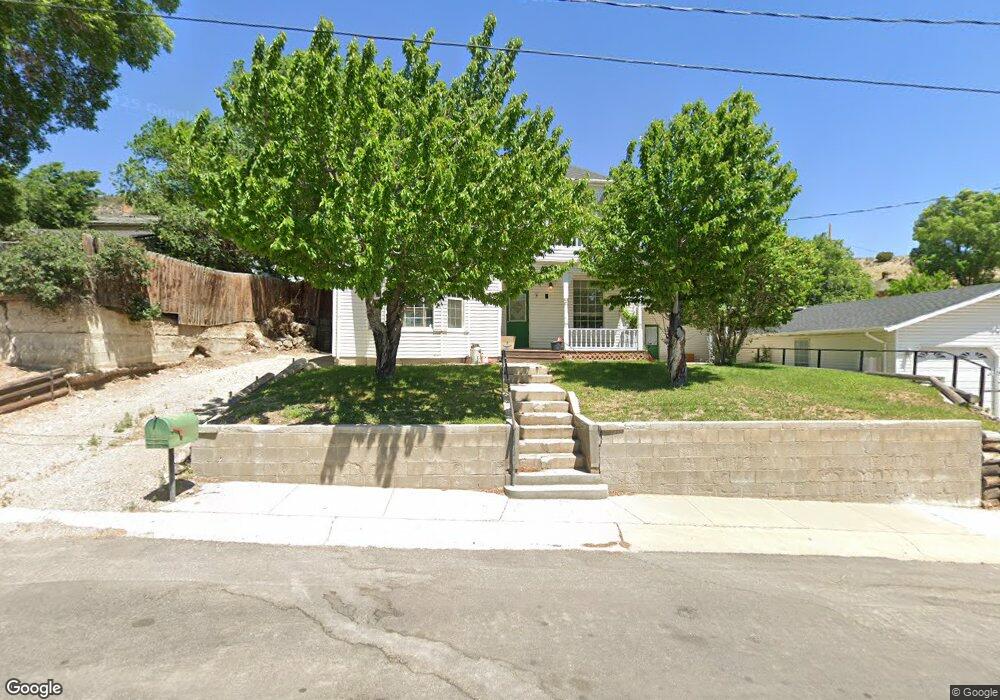
This home is located at 438 High St, Ely, NV 89301 and is currently estimated at $490,969, approximately $152 per square foot. 438 High St is a home located in White Pine County with nearby schools including David E. Norman Elementary School, White Pine Middle School, and White Pine High School.
Ownership History
Date
Name
Owned For
Owner Type
Purchase Details
Closed on
Sep 28, 2011
Sold by
Eardley Larry and Jim & Barbara Eardley Living T
Bought by
Ciscar Joe and Ciscar Family Trust
Current Estimated Value
Purchase Details
Closed on
Jun 9, 2005
Sold by
Newmaker Michael Jon and Newmaker Jacquelyn C
Bought by
Ciscar Joe
Purchase Details
Closed on
Jun 8, 2005
Sold by
Callahan Rodney Peter and Callahan Charoltte Grifall
Bought by
Ciscar Joe
Create a Home Valuation Report for This Property
The Home Valuation Report is an in-depth analysis detailing your home's value as well as a comparison with similar homes in the area
Home Values in the Area
Average Home Value in this Area
Purchase History
| Date | Buyer | Sale Price | Title Company |
|---|---|---|---|
| Ciscar Joe | -- | -- | |
| Ciscar Joe | -- | -- | |
| Ciscar Joe | -- | -- |
Source: Public Records
Tax History
| Year | Tax Paid | Tax Assessment Tax Assessment Total Assessment is a certain percentage of the fair market value that is determined by local assessors to be the total taxable value of land and additions on the property. | Land | Improvement |
|---|---|---|---|---|
| 2025 | $1,960 | $54,604 | $6,055 | $48,549 |
| 2024 | $1,960 | $54,258 | $5,425 | $48,833 |
| 2023 | $1,960 | $49,839 | $5,425 | $44,414 |
| 2022 | $1,682 | $43,991 | $4,725 | $39,266 |
| 2021 | $1,591 | $41,514 | $4,725 | $36,789 |
| 2020 | $1,559 | $42,902 | $4,725 | $38,177 |
| 2019 | $1,516 | $40,828 | $4,725 | $36,103 |
| 2018 | $1,474 | $39,465 | $4,725 | $34,740 |
| 2017 | $1,397 | $37,182 | $4,305 | $32,877 |
| 2016 | $1,372 | $36,174 | $4,305 | $31,869 |
| 2015 | $1,119 | $35,858 | $4,305 | $31,553 |
| 2014 | $1,119 | $36,044 | $5,110 | $30,934 |
Source: Public Records
Map
Nearby Homes
Your Personal Tour Guide
Ask me questions while you tour the home.