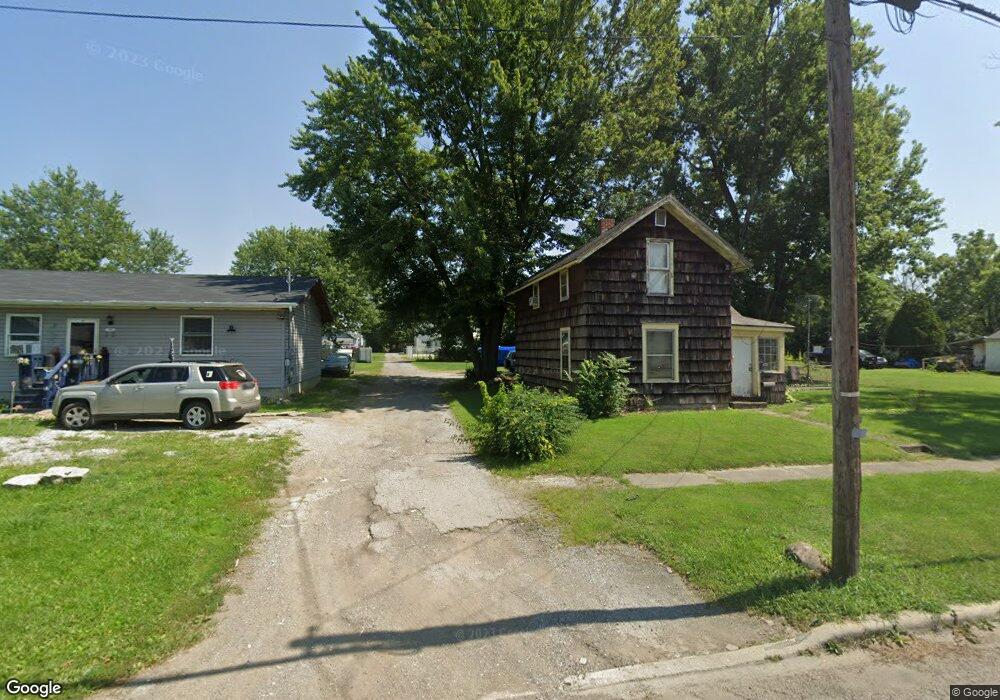
438 Lee St Marion, OH 43302
Estimated Value: $115,000 - $148,157
3
Beds
1
Bath
1,232
Sq Ft
$107/Sq Ft
Est. Value
About This Home
This home is located at 438 Lee St, Marion, OH 43302 and is currently estimated at $131,289, approximately $106 per square foot. 438 Lee St is a home located in Marion County with nearby schools including Rutherford B. Hayes Elementary School, Ulysses S. Grant Middle School, and Harding High School.
Ownership History
Date
Name
Owned For
Owner Type
Purchase Details
Closed on
Oct 4, 2019
Sold by
Manley Robert L and Manley Robert I
Bought by
Abrams Jesse J
Current Estimated Value
Purchase Details
Closed on
Feb 27, 2019
Sold by
The City Of Marion Ohio Land Bank
Bought by
Manley Robert L
Purchase Details
Closed on
Feb 13, 2012
Sold by
Timmons Sonya
Bought by
City Of Marion Land Bank
Purchase Details
Closed on
Dec 15, 2006
Sold by
Timmons Rodney E and Timmons Sonya K
Bought by
Timmons Sonya K
Purchase Details
Closed on
May 10, 2001
Bought by
Marion City Of Land Bank
Purchase Details
Closed on
Aug 30, 1996
Bought by
Marion City Of Land Bank
Create a Home Valuation Report for This Property
The Home Valuation Report is an in-depth analysis detailing your home's value as well as a comparison with similar homes in the area
Home Values in the Area
Average Home Value in this Area
Purchase History
| Date | Buyer | Sale Price | Title Company |
|---|---|---|---|
| Abrams Jesse J | $4,800 | None Available | |
| Manley Robert L | -- | None Available | |
| City Of Marion Land Bank | -- | None Available | |
| Timmons Sonya K | -- | None Available | |
| Marion City Of Land Bank | -- | -- | |
| Marion City Of Land Bank | $20,000 | -- |
Source: Public Records
Tax History Compared to Growth
Tax History
| Year | Tax Paid | Tax Assessment Tax Assessment Total Assessment is a certain percentage of the fair market value that is determined by local assessors to be the total taxable value of land and additions on the property. | Land | Improvement |
|---|---|---|---|---|
| 2024 | $1,563 | $28,350 | $2,070 | $26,280 |
| 2023 | $1,563 | $28,350 | $2,070 | $26,280 |
| 2022 | $1,386 | $28,350 | $2,070 | $26,280 |
| 2021 | $1,320 | $22,010 | $1,800 | $20,210 |
| 2020 | $297 | $1,800 | $1,800 | $0 |
| 2019 | $0 | $1,800 | $1,800 | $0 |
| 2018 | $0 | $1,680 | $1,680 | $0 |
| 2017 | $0 | $1,680 | $1,680 | $0 |
| 2016 | $0 | $1,680 | $1,680 | $0 |
| 2015 | -- | $1,680 | $1,680 | $0 |
| 2014 | -- | $1,680 | $1,680 | $0 |
| 2012 | $6,790 | $2,130 | $2,130 | $0 |
Source: Public Records
Map
Nearby Homes
- 523 Thompson St
- 355 Lee St
- 531 Toledo Ave
- 520 Toledo Ave
- 641 Blake Ave
- 485 Avondale Ave
- 468 Avondale Ave
- 134 Waterloo St
- 213 Sharp St
- 551 Universal Ave Unit 555
- 178 Leader St
- 343 Commercial St
- 347 Mary St
- 636 Mary St
- 233 Tully St
- 325 Holmes Place
- 403 Uncapher Ave
- 552 N Prospect St
- 374 Nunin Ct
- 395 N Main St